Chapter 25
The Energy Transition
The energy transition and oil: EVs, renewables, carbon markets, LCOE crossover, peak oil demand forecasts, and what comes next.
The Peak Demand Debate
For most of the oil industry's 165-year history, the central anxiety was supply: would the world run out of oil? The concept of peak oil, popularized by M. King Hubbert in 1956, argued that global production would inevitably reach a maximum and then decline as geological depletion outpaced new discoveries. By the 2020s, the shale revolution had effectively killed the supply-side peak oil thesis. The new question is the opposite one: when will the world stop wanting more oil?
Two credible institutions answer that question in completely different ways, and the gap between them is the single most consequential forecast disagreement in energy today. The International Energy Agency's World Energy Outlook 2025, published in Paris on November 12, 2025, shows global oil demand plateauing in the late 2020s and drifting lower through 2050 under its Stated Policies Scenario. OPEC's World Oil Outlook 2025, published from Vienna, projects continued growth to roughly 120 million barrels per day by 2050. The spread between these two reference cases at 2050 is wider than the entire current production of Saudi Arabia. One of them is very wrong.
Figure 25-1: Global Oil Demand: IEA STEPS vs OPEC WOO, 2020 to 2050
OECD and Non-OECD Divergence
Under the surface, the world is already two markets. Oil demand in OECD countries, which means most of Europe, North America, Japan, South Korea, and Australia, peaked in 2005 near 50 million barrels per day and has been flat to declining ever since. The growth that pushed total world demand from 85 million barrels per day in 2005 to roughly 103 million in 2024 has come entirely from non-OECD countries, led by China, India, and Southeast Asia. Non-OECD demand is now comfortably above 55 million barrels per day and still climbing. The peak-demand question is really three questions: when does China peak, what path does India follow, and does Africa ever reach the car-ownership density that would meaningfully lift global demand? The IEA and OPEC disagree on all three.
Electric Vehicles
Electric vehicle adoption accelerated faster than most forecasters expected. Global plug-in car sales, counting battery electric and plug-in hybrids, rose from roughly 2 million units in 2018 to about 17 million in 2024. The IEA's Global EV Outlook 2025 reports that more than one in four cars sold worldwide in 2025 will be electric. China alone bought around 11 million of the 2024 total, more than two-thirds of global sales. Europe plateaued near 3 million units after the 2023 pullback in German and French subsidies, and the United States held at roughly 1.6 million, with Tesla still the largest seller but Chinese platforms (blocked from the US market by import rules and 100 percent tariffs) dominating elsewhere.
Figure 25-2: Global EV Sales (BEV + PHEV) vs Total Auto Sales, 2018 to 2025
EV Sales by Region (2024)
| Region | 2024 EV Sales | Share |
|---|---|---|
| China | roughly 11.0 million | 63% |
| Europe | roughly 3.2 million | 18% |
| United States | roughly 1.6 million | 9% |
| Rest of world | roughly 1.7 million | 10% |
| Global total | roughly 17.5 million | 100% |
China's BYD, founded in 1995 as a battery manufacturer, has become the world's largest plug-in vehicle producer by total units, helped by a vertically integrated battery supply chain that runs from lithium refining through cell manufacturing. European producers, led by Volkswagen, Stellantis, BMW, and Mercedes, have rolled back 2030 internal-combustion phase-out targets under pressure from Chinese imports and softer consumer demand. The European Union began imposing countervailing tariffs on Chinese EVs in late 2024. The United States responded with a 100 percent tariff on Chinese EVs and, separately, with restrictions on battery components from Chinese sources. The result is three regional markets increasingly walled off from one another, each on its own policy trajectory.
The oil demand impact is real but bounded. The IEA estimates that global EV adoption was displacing roughly 1.8 million barrels per day of gasoline and diesel demand by 2024, with the figure potentially reaching 5 to 6 million barrels per day by 2030 under current-policy trajectories. Set that against an oil demand base over 100 million barrels per day and the continued growth of plastics, petrochemicals, aviation, and heavy trucking, none of which electrify easily.
The Cost Collapse in Solar and Wind
Power generation economics changed as the levelized cost of utility-scale solar and onshore wind fell. Lazard's annual LCOE study, now in its seventeenth edition, puts unsubsidized utility-scale solar at roughly 60 dollars per megawatt-hour at the midpoint in 2024, down from 359 dollars in 2010. Onshore wind followed a parallel path, from 135 dollars to 50 dollars per megawatt-hour over the same window. Both now sit comfortably below combined-cycle natural gas in most US markets on a new-build basis before any subsidies are counted.
Figure 25-4: Unsubsidized LCOE, 2010 to 2024 (USD per MWh)
The 2022 and 2023 data points include a rebound. Capital costs rose with the post-pandemic interest rate cycle, module and balance-of-system costs rose with steel and aluminum inflation, and lithium prices tripled briefly before collapsing again in 2024. The long-run trajectory has resumed, but the low-2020s trough turned out to be the bottom of a U, not a permanent floor. For solar in particular, the best utility-scale sites in Texas, the Middle East, and the Australian outback still clear below 30 dollars per megawatt-hour, and IRENA reports that nearly all new solar capacity commissioned in 2024 came in below the cheapest fossil-fuel alternative.

Renewable Additions and the Gas Paradox
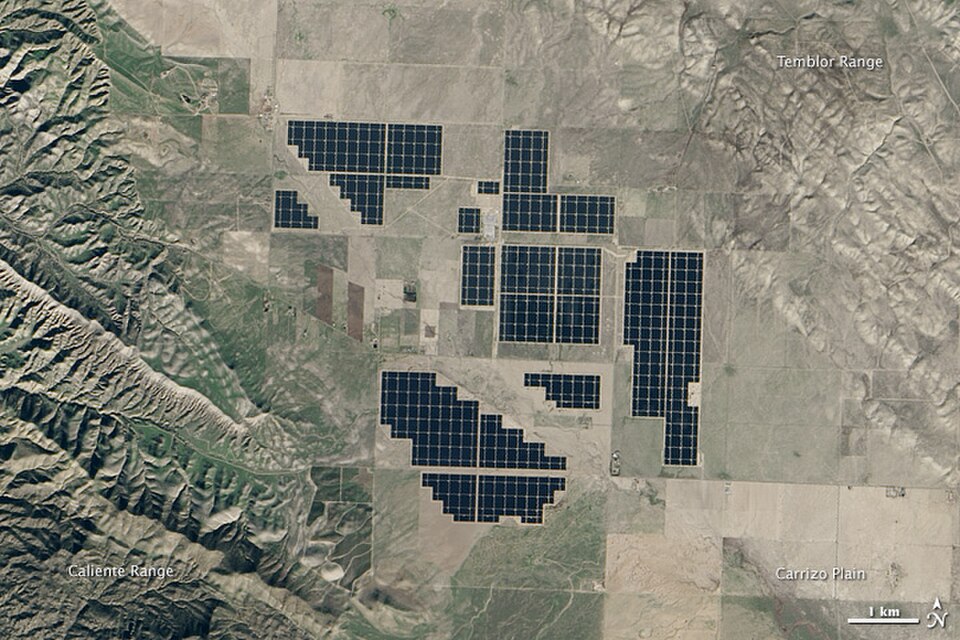
Global renewable capacity additions set a record in 2024. According to IRENA and the IEA, the world added roughly 560 gigawatts of solar, 115 gigawatts of wind, and smaller volumes of storage, hydro, and geothermal. Solar accounts for close to three-quarters of all new capacity, and China alone installed more solar in 2024 than the rest of the world combined. Grid-scale battery additions have started to scale in parallel, with 2024 global additions near 175 gigawatt-hours.
The gas paradox.
The intermittency of solar and wind means natural gas remains essential as a dispatchable backup fuel. Gas turbines can ramp up and down in minutes, covering the gaps when the wind does not blow and the sun does not shine. In many markets the growth of renewables has actually increased the dispatchable need for natural gas, not reduced it. US gas demand from power generation set an all-time high in 2024 even as solar and wind capacity grew to records. Every new gigawatt of intermittent renewables makes a complementary gigawatt of flexible gas (or battery storage) more valuable, not less.
Figure 25-7: Global Renewable Capacity Additions (GW), 2015 to 2025
Sources: IRENA, IEA Renewables 2024 (illustrative)
What LCOE Leaves Out
A levelized cost divides everything a plant will ever cost by everything it will ever generate. That is the right number for asking what a megawatt-hour costs to produce, and it is silent on the question that decides whether a grid works, which is when the megawatt-hour arrives. Two plants with the same levelized cost are not worth the same money if one can be called at seven on a winter evening and the other cannot. The chart above measures a production cost rather than the cost of serving demand, and the gap between those two is where the transition gets expensive.
That gap shows up first as waste. The EIA puts California’s curtailment of utility-scale wind and solar output at 3.4 million megawatt-hours in 2024, 29% more than in 2023, and 93% of what the grid operator discarded was solar. The curtailment clusters in spring, when the panels produce heavily and mild weather means little demand for heating or cooling. Prices say the same thing more sharply. California ran roughly 1,180 hours of negative wholesale power prices in 2024, about 13% of the year and more than double the 2023 count. A negative price is a generator paying to keep running, and a system that produces one for an eighth of the year is making more of something in those hours than it can absorb.
The version of this that reaches an investor is the capture rate, the average price a technology’s output earns divided by the average price across all hours. German solar captured 98% of the market price in 2022 and about 54% in 2025, dropping to 43% and 44% in the May and June readings. The cause is correlation rather than cost. Every panel in a price zone produces in the same hours, so each one added bids into a window its neighbours have already filled and pushes down the price all of them receive. Solar erodes its own revenue as it scales, which is a property no thermal plant has. A gas turbine does not cut its own price by running.
So the limit that binds is economic and locational rather than technical. Nothing physical stops the panels going up, and China installed more solar in 2024 than the rest of the world combined while module prices kept falling. What stops them earning is that an extra megawatt-hour at noon in a sunny zone falls toward zero in value long before any engineering ceiling is reached. Everything that would fix that sits outside the generation bill: storage to move energy across hours, transmission to move it across zones, flexible demand to move consumption toward it, and dispatchable plant for the evenings when none of the three is enough. Those are the costly parts, and a levelized cost of generation contains none of them.
For an oil reader the consequence is the gas paradox above with a number attached. A forecast that reads the crossover in the chart and concludes that fossil generation is finished has priced the cheap half of the problem, which is part of why US gas burn for power set a record in the same year solar and wind capacity did, and part of why peak-demand forecasts drawn from cost curves have arrived early more than once. How a grid prices and dispatches all of this, and who pays for the hours after the sun has gone down, is the subject of Power 101, the companion volume on electricity markets.
Carbon Markets and the EU ETS
Carbon pricing has expanded unevenly. The EU Emissions Trading System, the world's largest cap-and-trade market, saw allowance prices climb from under 10 euros per tonne in 2017 to a record near 100 euros per tonne in February 2023 before moderating into a 65 to 80 euro range through 2024 and 2025 as free allocation continued to phase out and carbon border adjustment mechanism (CBAM) reporting became mandatory for imported steel, aluminum, cement, fertilizers, and electricity. CBAM imposes carbon levies on imports from countries without equivalent domestic pricing starting in January 2026, in what is the single largest extraterritorial extension of climate policy to date.
Voluntary carbon markets had a harder run. A series of 2023 investigations into forestry-based offsets found that many credits overstated their climate benefit, and corporate buyers retreated. The voluntary market contracted sharply in 2024, and integrity standards bodies such as the Integrity Council for the Voluntary Carbon Market (ICVCM) and the Science Based Targets initiative (SBTi) are still working through rules for which credit types remain acceptable against corporate net-zero claims.
The IRA and the 2025 Rollback
The 2022 US Inflation Reduction Act was, at the time, the largest climate investment in any country's history, projected at 370 billion dollars of credits and direct-pay incentives for clean energy, batteries, manufacturing, EVs, hydrogen, and carbon capture. Actual uptake far outran the Congressional Budget Office estimate, reaching well above one trillion dollars of headline value by 2025 depending on which forecaster you trust. Under the One Big Beautiful Bill Act, signed July 4, 2025, large parts of the IRA were rolled back. The 30D new clean vehicle credit, the 25E used clean vehicle credit, and the 45W commercial clean vehicle credit were terminated for vehicles acquired after September 30, 2025. The 25C and 25D residential energy credits expire for property placed in service after December 31, 2025. The 48E and 45Y technology-neutral power credits survived for wind and solar projects only where construction begins by June 2026 or the project enters service by December 2027, under a safe harbor framework tightened by new foreign entity of concern restrictions. The 45X advanced manufacturing credit, the 45Q carbon sequestration credit, and biofuel credits remained largely intact, and nuclear power received a new 10 percent bonus credit. The 45V clean hydrogen production credit was not reduced in per-kilogram value but had its termination date pulled forward from 2033 to the end of 2027, effectively ending the window for new projects to qualify. Investment plans across the EV and hydrogen sectors were reset in 2025 in response.
Carbon Capture and Hydrogen
Carbon capture, use and storage has moved from lab to early commercial deployment. The Climeworks Orca plant in Iceland began operating in 2021 and was joined by a larger Mammoth facility in 2024, both using direct air capture with basalt mineralization. In the US, Occidental and partners broke ground on the Stratos direct-air-capture facility in West Texas in 2023 and brought initial phases online in 2025. The Petra Nova post-combustion CCS plant near Houston restarted in 2023 after a pandemic shutdown. The Northern Lights CO2 transport and storage project offshore Norway took its first cargo in 2025. These are real projects, but their combined capacity is still small compared to the gigatonnes of capture that net-zero pathways call for.
Hydrogen has been more disappointing. Green hydrogen, produced by electrolysis from renewable power, remains expensive because electrolyzers are capital-intensive and because running them at the low capacity factors implied by intermittent input raises unit cost. The 45V tax credit in the original IRA, paying up to 3 dollars per kilogram for the cleanest hydrogen, was expected to close the gap; the 2025 reconciliation bill kept the rate but pulled the termination date forward from 2033 to the end of 2027, sharply shortening the window to start qualifying projects. The result is that hydrogen retains credibility for sectors where the alternatives are worse (ammonia fertilizer, direct reduced iron for green steel, some long-haul heavy trucking) and loses traction in sectors where cheaper alternatives exist (passenger cars, residential heating, most utility power).
The Investment Paradox
The transition has created an investment paradox. If oil demand will decline, new long-cycle projects risk becoming stranded assets that cannot pay back their capital over a shortened productive life. But if the industry underinvests on peak-demand expectations and demand turns out to be more resilient than forecast, the world gets a supply shortage and a price spike, which then funds a new wave of investment and extends the production tail. That scenario unfolded in 2021 and 2022, when the post-pandemic demand recovery collided with several years of underinvestment and sent Brent briefly above 120 dollars. The lesson: the demand curve can roll over faster than the supply curve can adjust, and running the oil system tight as a policy tool is expensive and unpopular.
For producers, the pragmatic response has been capital discipline: return cash to shareholders through buybacks and dividends, hedge forward production through swaps, collars, and three-way structures, and let the long-cycle supply side of the market tighten through attrition rather than through policy choice. It is not a climate strategy, but it is a survivable commercial one.
Peak Demand or Peak Fossil Fuel?
The loose shorthand of "peak oil demand" hides a finer distinction. Global coal demand is clearly plateauing, led by a slow rollover in China and earlier declines in Europe and the United States. Natural gas demand is still growing, pulled by LNG exports and by the paradox described above. Oil demand is the hardest call, because so much of it is in sectors that either electrify slowly (road fuel, especially heavy duty) or not at all (petrochemicals, aviation, maritime bunker fuel). A reasonable working assumption at the start of 2026 is that oil demand plateaus in the late 2020s in an OECD-led rollover, that a slow decline follows in the 2030s, and that the industry remains materially larger than most public narratives suggest for decades after that. The exact slope depends on Chinese and Indian transport choices and on whether the 2025 IRA rollback actually slows US EV uptake in practice.
The energy transition is a multi-decade process rather than a single event, unfolding at different speeds in different sectors and different countries. Oil and gas will remain major energy sources for the working careers of most people reading this book, even under aggressive transition scenarios. The challenge for the industry, and for anyone pricing, trading, or hedging energy risk, is that the direction is clear but the timing is not, and the two largest forecasting bodies in the world cannot agree on 2050 by 40 million barrels per day.