Chapter 26
Iran Blocks the Strait
The 2026 Strait of Hormuz crisis: Iran blockade, 12 Mbpd shut in, oil at $166, SPR countdown, and 15 market consequences.
The Chokepoint
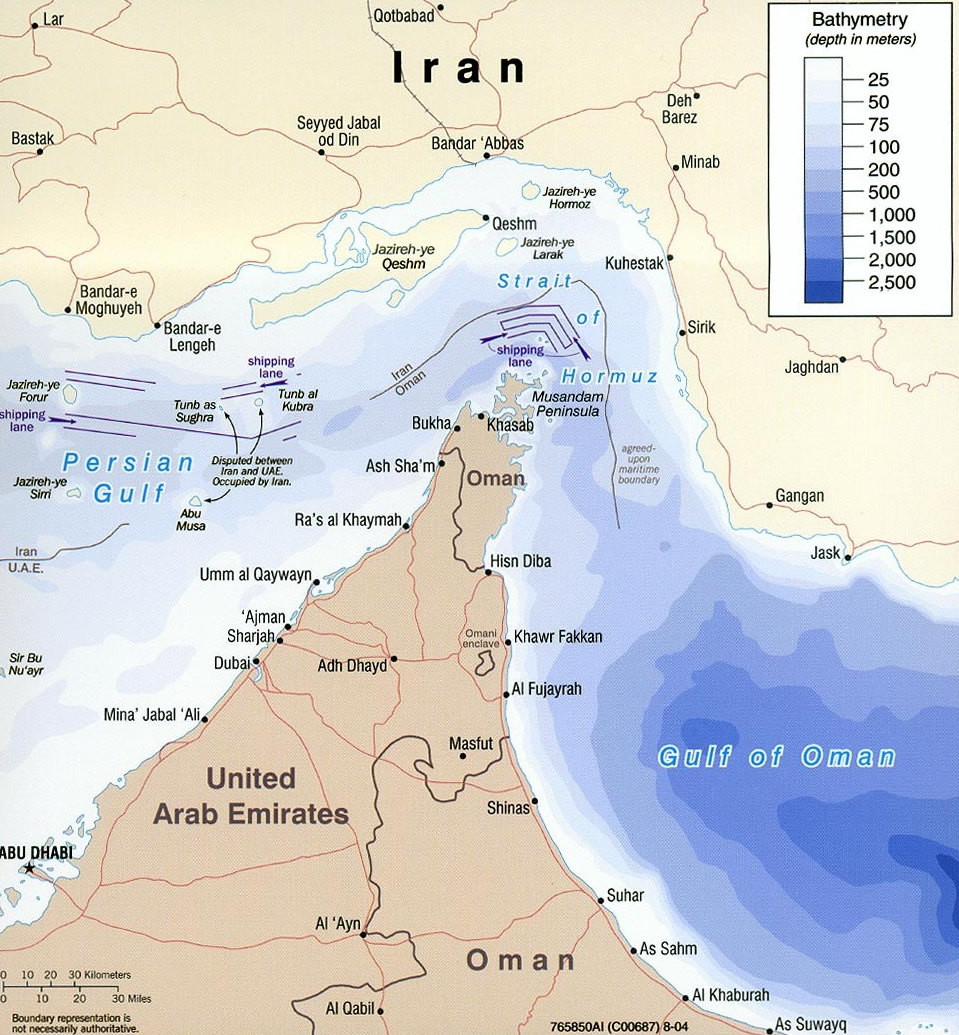
The Strait of Hormuz is the most concentrated energy risk on earth. At its narrowest it is 21 miles wide, and all commercial traffic funnels through a shipping lane just six miles across: two miles inbound, two miles of buffer, two miles outbound. Through that corridor moves roughly 20 million barrels a day of crude oil, refined products, and LNG, about a fifth of global petroleum liquids consumption. No other passage on earth carries more energy value, and there is no quick way around it: the alternatives are pipelines that move less than half the volume, and they take years to build.
For four decades, oil traders, military planners, and energy analysts rehearsed a Hormuz closure as the ultimate tail risk and priced its probability at close to zero. On February 28, 2026, the rehearsal ended. Nearly four months later the crisis did too: an interim deal struck on June 14 and signed on June 17 reopened the strait, lifted the US naval blockade and oil sanctions, and ended Iran’s shipping restrictions, with a 60-day window to negotiate Iran’s nuclear program. Crude collapsed on the news, falling roughly 15% in the week to around $74 WTI from a crisis peak above $120 as tankers began returning to the Gulf. The recovery then ran faster than anyone modeled: within two weeks, and despite a brief re-closure and fresh attacks, transits were back inside the pre-war band of 30 to 40 tankers a day, and the market had flipped from pricing a shortage to fearing a glut, with banks cutting Brent forecasts toward $75. The crisis proper was a bounded event, February 28 to June 17, 2026; the skirmishing that has continued since, including Trump declaring the ceasefire ended in early July after Iranian forces fired on ships, is post-deal boundary testing rather than a return to closure, and this chapter treats the closure as the finished episode it now is. This chapter uses the closure as a case study in how a chokepoint shock propagates through the oil market, the structural lessons it leaves behind, and a compressed record of how the crisis unfolded and how it ended. The live status block above tracks where it stands today.
Anatomy of a Closure
A strait closure does not hit the market all at once. It propagates in a sequence: insurance and shipping freeze first, prices reprice on the threat before a single barrel is physically short, production shuts in because there is nowhere to put the oil, alternatives prove necessary but insufficient, and the inventory cushion determines how long the system holds before demand has to be rationed. The 2026 crisis ran the full sequence.
Insurance and shipping freeze first. Within 48 hours of the first IRGC radio warnings, at least three tankers were struck and incoming traffic dropped to near zero. War-risk insurance, not military force, is what actually closes a strait. As attacks mounted, protection and indemnity clubs withdrew war-risk coverage, premiums on hull value blew out from a fraction of a percent to multiples of it, and vessels still moving switched off their AIS transponders or broadcast false positions to avoid being targeted. A tanker cannot sail without coverage, and no underwriter will write a policy on a route where ships are being sunk. By mid-March at least 28 attacks had been confirmed or claimed: one tug sunk, 16 merchant ships damaged, twelve seafarers dead or missing. The waterway was technically still open. It was commercially dead.
The Price Shock
Brent crude opened February 28 near $80 per barrel. By March 8 it had reached $126. As the physical market tightened, Dubai crude, the benchmark for Middle Eastern sour grades, reached $166 on March 19, exceeding the July 2008 all-time high of $147 for WTI. It was the most expensive barrel of crude ever traded in nominal terms. The Hormuz closure compressed a larger move than the 2022 Russia-Ukraine shock into a fraction of the time.
European natural gas followed. Prices roughly doubled in a week after Qatar, the world's second-largest LNG exporter, stopped production on March 2 and declared force majeure on March 4. European buyers who had congratulated themselves on replacing Russian pipeline gas with Qatari LNG discovered their new supply chain ran through the same six miles of water. The shock rippled into adjacent commodities: urea fertilizer up 50% by late March (the Gulf supplies roughly 30% of globally traded fertilizer), helium rationing, sulfur supply to US industry near-totally disrupted. Once talks were signaled the price stopped tracking barrels and started tracking diplomacy, snapping up and down on each headline about whether and on whose terms the strait would reopen.
Figure 26-2: Brent Crude, European Gasoil, and Jet Fuel (US$/bbl) Jan-Jul 2026
Forced Shut-Ins
Gulf producers did not cut output voluntarily. They cut because they had nowhere to put the oil. With tanker loading suspended and onshore storage filling, the shutdowns were forced. Iraq dropped from 4.3 to 1.3 Mbpd by March 8 and began shutting Rumaila, its largest field, on March 17 after storage was exhausted. Saudi Arabia cut 20%, from roughly 10 to 8 Mbpd, shutting offshore fields including Safaniya, the world's largest. Kuwait and Qatar declared force majeure. By March 30 regional exports had fallen 60%, from roughly 25 to 10 Mbpd, the largest involuntary production shut-in in the history of the oil industry. The 2020 COVID cuts removed a similar volume, but those were voluntary and coordinated through OPEC+. These were the consequence of a physical blockade.
Table 26-1: Hormuz Transit by Exporter (2024, Pre-Crisis)
| Country | Crude + Condensate (Mbpd) | Notes |
|---|---|---|
| Saudi Arabia | 5.5 | Eastbound cargoes; westbound via Red Sea bypasses Hormuz |
| Iraq | 3.3 | Basra oil terminal; Kirkuk-Ceyhan exports bypass Hormuz |
| UAE | 2.5 | Partly bypassed via Habshan-Fujairah pipeline (1.5 Mbpd cap.) |
| Kuwait | 1.7 | All exports transit Hormuz; no bypass pipeline |
| Iran | 1.5 | Kharg Island; Iran exempted own and allied cargoes |
| Qatar | 0.5 + LNG | Small condensate volumes; massive LNG exports (80 Mtpa) |
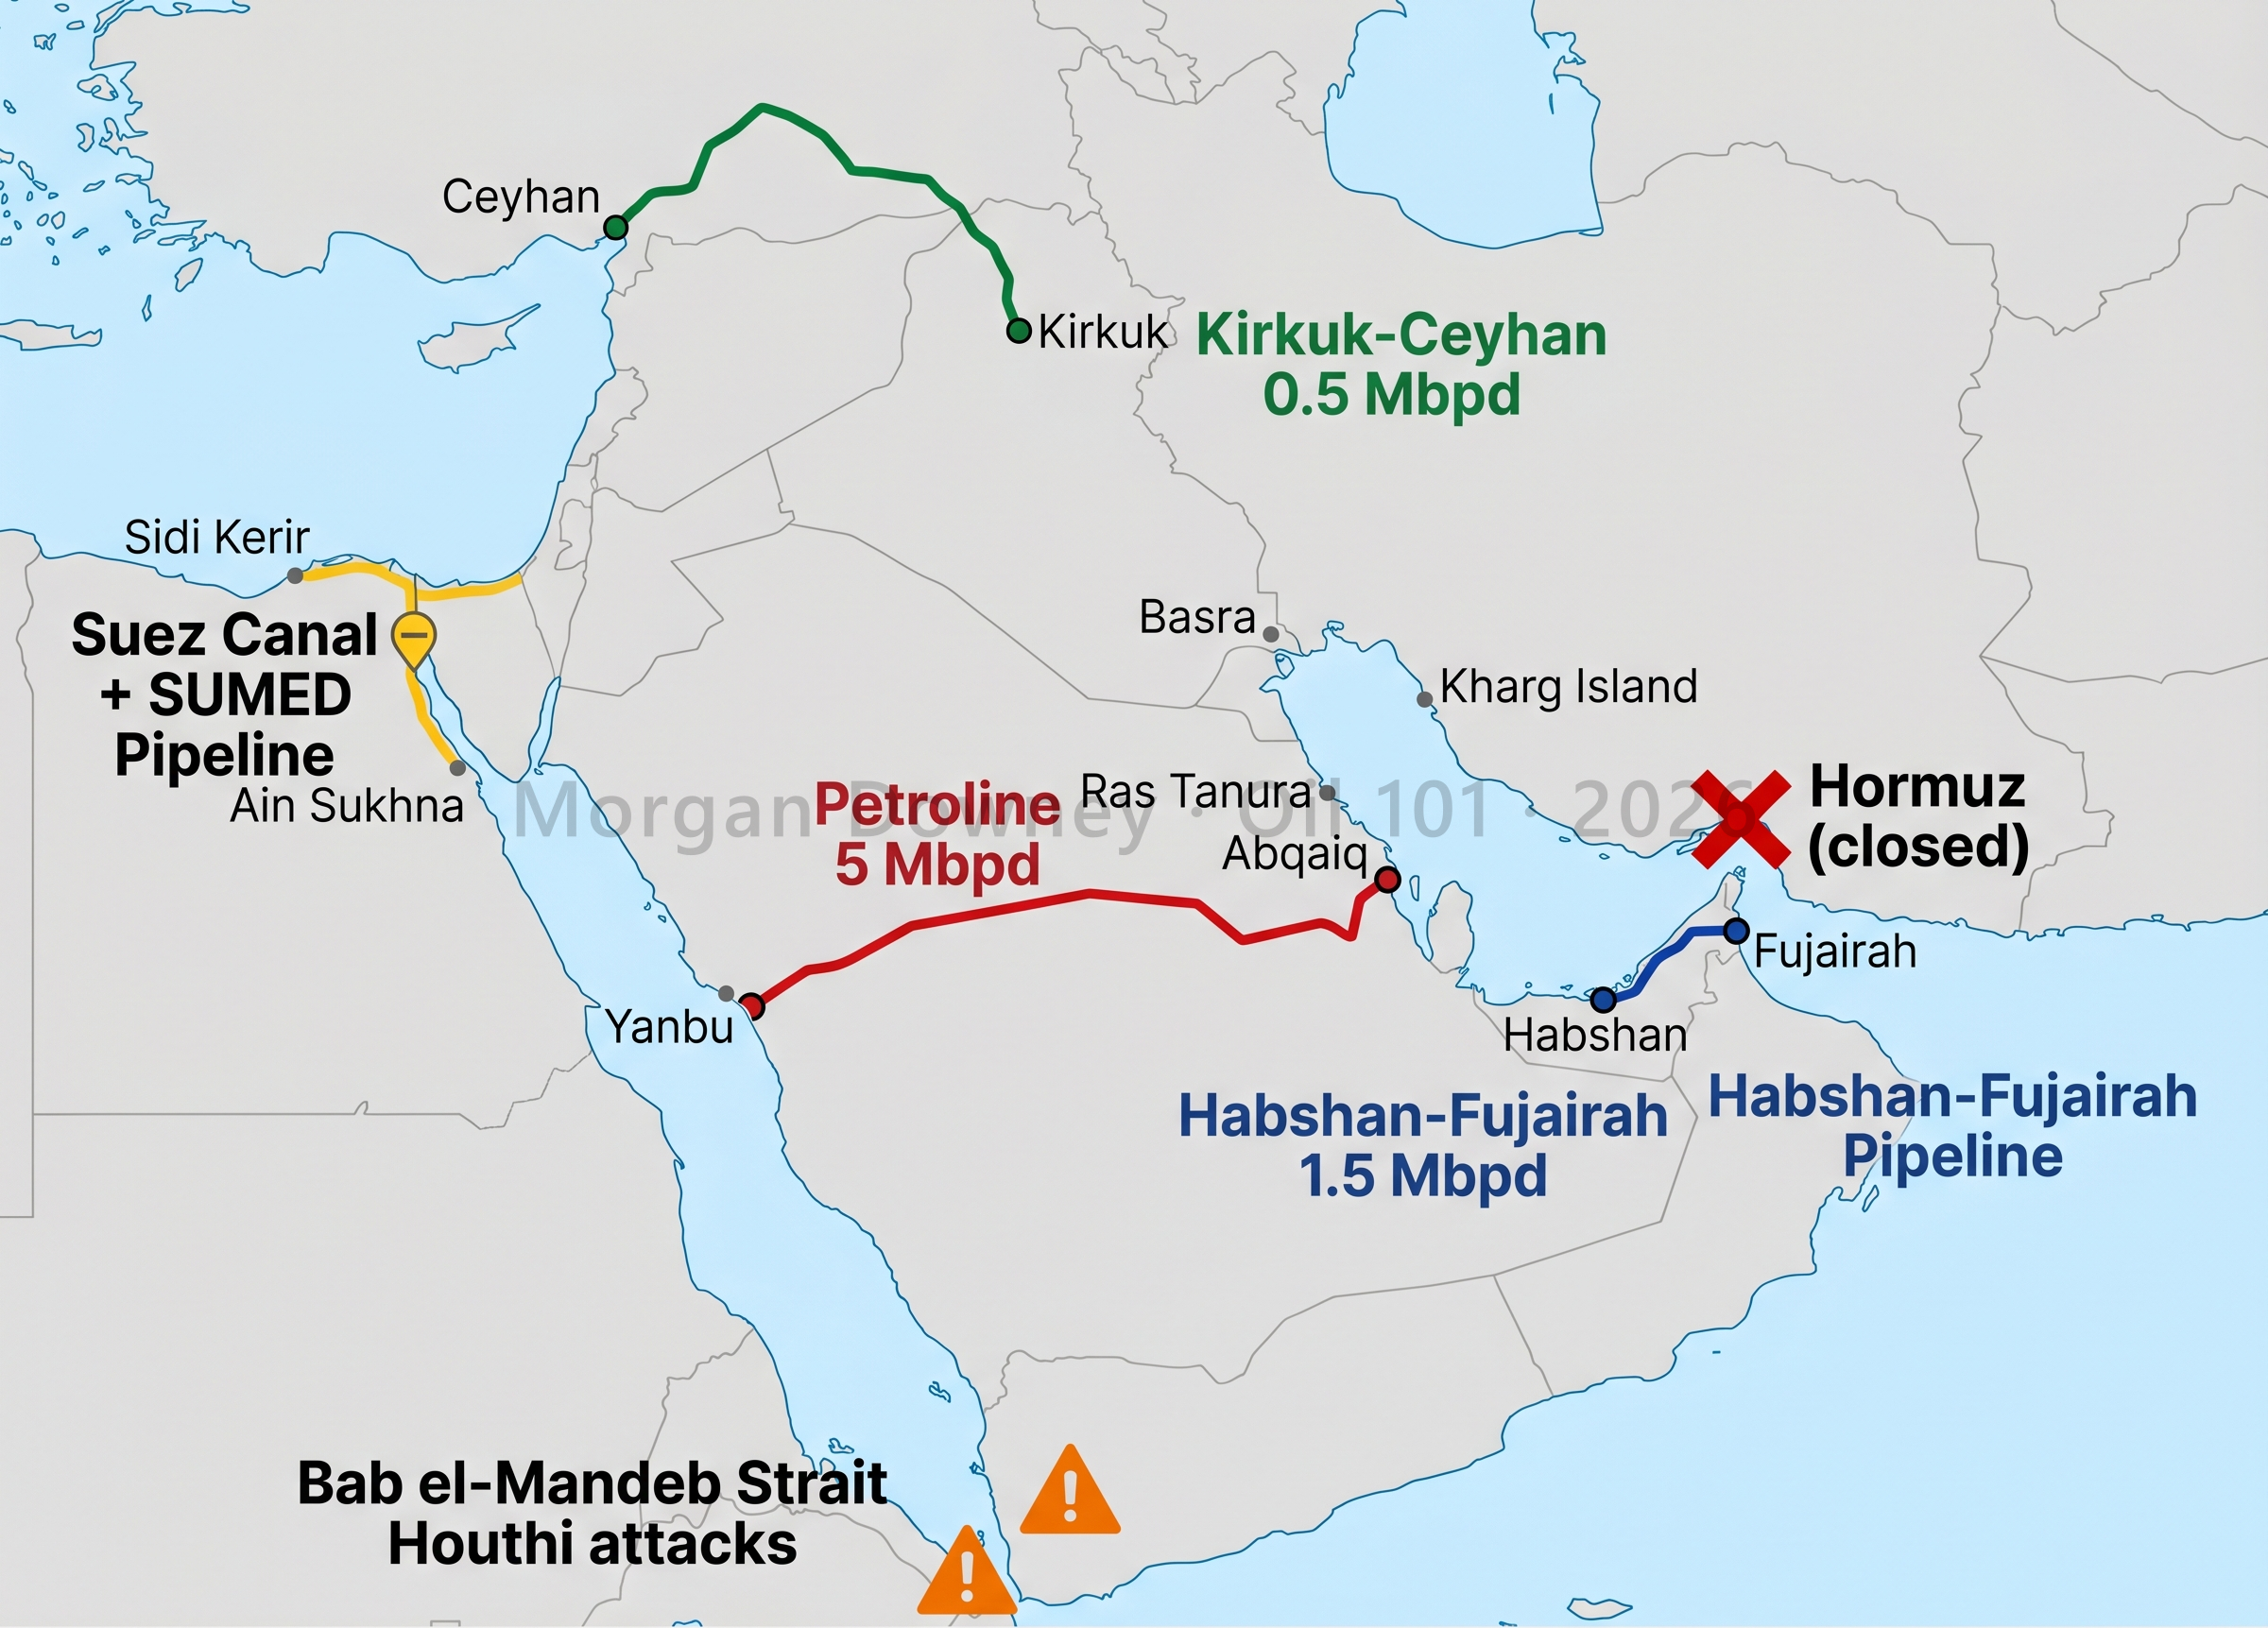
The Bypass Pipelines and Their Ceiling
Three pipelines can move Persian Gulf crude to ports that do not require Hormuz transit, and all three were activated within two weeks of the closure. The Saudi East-West Pipeline (Petroline) runs from Abqaiq to the Red Sea port of Yanbu, roughly 5 Mbpd of capacity, and Saudi Arabia had kept it partially loaded for exactly this contingency. The UAE Habshan-Fujairah pipeline moves Abu Dhabi crude to the Arabian Sea coast at Fujairah, bypassing Hormuz entirely, roughly 1.5 Mbpd. The Iraq Kirkuk-Ceyhan line moves northern Iraqi crude overland through Turkey to the Mediterranean, roughly 0.5 Mbpd.
Combined bypass capacity is roughly 7 to 9 Mbpd against the 20 Mbpd that normally transits Hormuz. The pipelines covered less than half the lost volume; the remaining gap, roughly 11 Mbpd of stranded production, was the largest involuntary supply shortfall the oil market has ever seen. There is a further trap. The Yanbu route sends crude into the Red Sea, which as of early 2026 was still under Houthi attack (see Chapter 11 (Transporting Oil)). Bypassing Hormuz only exposed cargoes to the Bab el-Mandeb. The world's two most important oil chokepoints were compromised at once.
A Two-Tier Market
Iran did not close the strait to everyone. It closed it selectively, and in doing so created a two-tier global oil market with no modern precedent. By late March, Iran was permitting transit for vessels from a handful of friendly states (China, Russia, India, Iraq, Pakistan, later others) while declaring the strait closed to all traffic to and from the United States, Israel, and allied ports. The blockade was not universal; it was directional. Iran was using Hormuz as a sorting mechanism: partners could transit, adversaries could not.
That bifurcated the price of crude itself. Asian-delivered Gulf barrels, moving under Iranian permission, traded at one level; Atlantic-basin crude, cut off from Gulf supply, traded at a scarcity premium. Iran then added a financial layer, running a channel north of Larak Island and charging tolls that exceeded $1 million per vessel, reportedly assessed in Chinese yuan, with at least one ship paying $2 million. It was a piracy tax wrapped in sovereignty language. The strait had stopped being infrastructure and become leverage: any nation that wanted Gulf oil had to deal directly with Tehran.
Who Is Most Exposed
The countries most dependent on Hormuz are, by definition, the ones that import the most Gulf oil, and the list is dominated by Asia. China, Japan, South Korea, and India together account for roughly 60% of Hormuz-transiting crude. Europe's crude exposure is lower because it leans on the North Sea, Russia, West Africa, and the Americas, but its Qatari LNG imports are nearly 100% Hormuz-dependent. The United States, a net petroleum exporter since the shale boom, is the least directly exposed major economy (see Chapter 1 (A Brief History of Oil)).
Table 26-2: Major Importer Hormuz Exposure
| Country | Hormuz Share of Oil Imports | Strategic Reserve Days | Bypass Options |
|---|---|---|---|
| Japan | 80% | 140+ | None; island nation, no pipeline alternatives |
| South Korea | 70% | 90+ | None; peninsula, no pipeline alternatives |
| India | 60% | 40 | Limited; ISPRL reserves at Visakhapatnam, Mangalore, Padur |
| China | 40% | 80-90 | ESPO pipeline; diversified to Brazil, West Africa |
| Europe (EU) | 15-20% | 90+ | North Sea, Norway, West Africa, Americas; but Qatar LNG at risk |
| United States | 5% | 80 | Domestically self-sufficient; SPR for global coordination |
Figure 26-4: Hormuz Exposure vs. Strategic Reserve Cover by Importer
SPR days of cover = total strategic reserves divided by total net imports from all sources, not just Hormuz. Sources: EIA, IEA, JOGMEC, KNOC, ISPRL, industry estimates (China).
Why Oil Hasn’t Broken $200
By the numbers this was a worse fundamental shock than 1973 or 1979. Cumulative supply shut-in since February 28 crossed 1.1 billion barrels, against roughly 4 to 5 Mbpd removed in each of the 1970s crises. Brent topped $147 in 2008 on a smaller imbalance. Yet front-month WTI held in a $90 to $130 range throughout, well below the $200-plus scenarios banks and officials modeled in the first weeks, and once the deal was signed on June 17 it fell back to the mid-$70s, near where it began, down about 15% on the week. Three buffers explain why the price never broke $200, and only one is conventional.
Strategic releases. On March 11 the IEA's members committed to release up to 400 million barrels, the largest coordinated SPR commitment ever, more than double the 2022 Ukraine release. But 400 million barrels is only about four days of global consumption, and the figure is an announced ceiling, not a delivery schedule. The US SPR drew 41 million barrels in the first eleven weeks (415 million on February 27 to 374 million by May 15), with the two largest weekly draws on record hitting in early May. The announcement worked mainly as a signal that governments would intervene at scale; refilling drawn barrels at $100-plus would cost tens of billions (see Chapter 12 (Storage)). The episode left a clear verdict that the metal was worth it: days after the deal, Saudi Aramco’s chairman said the company was weighing far larger oil-storage facilities around the world, pointing to China’s and the United States’ strategic stockpiles as the reason the disruption was not far worse. Strategic storage, long derided as idle capital, was the buffer that bought the time for diplomacy to work.
Dark-fleet inventory. Iran's shadow fleet, the network of older tankers running with falsified or absent AIS signals, had been holding 100 to 180 million barrels at sea before the closure (Kpler and Vortexa estimates). As the strait shut and the US blockade tightened, Iran's onshore tank farms drained into the fleet, and those dark cargoes have been worked down through the spring, releasing supply the official OECD numbers never tracked, roughly 15 days of strait outage worth.
Inventory efficiency. The largest buffer is the least visible. Over the last decade, machine-learning demand forecasting and real-time supply-chain telemetry have cut the working inventory the oil system needs to run, on the order of 30% across the supermajors and large distribution systems. Applied to roughly 3 billion barrels of OECD commercial inventory, that is close to 1 billion barrels of structural buffer that did not exist in 2010. The toolkit is unglamorous, boosted-tree demand forecasters, AIS-derived shipment nowcasting, refinery-turnaround coordination, retail-offtake telemetry, and it produces no headlines. Tracking tanker AIS was the cutting-edge edge of 2010, and it is gone now that everyone has it; the next edge is in the silent AI-efficiency layer that never shows up in the inventory tally.
The combined effect was roughly a 130-day cushion. OECD commercial inventories fell more than 300 million barrels between February 28 and mid-June with no on-screen panic, the kind of drawdown that would have produced visible scrambling in 2010. None of these buffers is permanent: SPR refill is slow and politically expensive, the dark fleet is finite and was being drawn down, and efficiency only buys time, not new supply. The June 14 deal arrived with the cushion nearly spent, net oil-importer reserves down to roughly 200 million barrels, about three weeks short of the modeled run-dry. Had talks failed once more and the strait stayed shut into July, the math turned sharply harder and the $200 scenarios would have become live. The system absorbed a four-month closure of the world’s most important chokepoint without breaking, but it came closer than the calm price action ever suggested.
Figure 26-5: Global Oil Stocks Before, During, and After the 2026 Hormuz Crisis
Sources: IEA Oil Market Report, DOE SPR Quick Facts, EIA, JOGMEC, KNOC, IEA Emergency Response Reviews. Days of coverage computed against roughly 104 Mbpd global consumption.
Figure 26-6: Global Strategic Petroleum Reserves by Country/Region, 1977 to 2026
Sources: EIA Weekly Petroleum Status Report (US SPR series WCSSTUS1), DOE SPR Quick Facts, JOGMEC, KNOC, IEA Emergency Response Reviews
The SPR Defends Crude, Not the Pump
The strategic releases did real work, but they revealed a limit that the headlines missed. A strategic petroleum reserve holds crude, not refined products. When the IEA members and the US drew down their tanks, they added crude to a market that was already being told crude was scarce, and it worked: front-month crude was capped, and once the deal landed it was crushed, falling from a $114 April peak to about $72 by late June. But no reserve on earth stores gasoline, diesel, and jet fuel at that scale. The scarcity did not vanish when crude fell. It moved one step down the barrel, from the crude price to the refining margin, where there is no strategic reserve to release and no government tool to cap it.
The measure of that transfer is the 3:2:1 crack spread, the refiner’s gross margin on turning three barrels of crude into two of gasoline and one of distillate. A normal 3:2:1 margin runs $10 to $20 a barrel. Through the spring it reached the mid-$50s, matching the territory of Hurricane Katrina and the 2008 dislocation. Then came the tell: as the releases and the June settlement pulled crude down, the margin did not follow it down. It climbed to roughly $61 a barrel by late June, its high for the year, moving in the opposite direction from the crude price. A consumer feels the pump, and the pump is a product price; the SPR is a crude tool. In 2026 the gap between the two, the refining margin, is where the crisis went to live once crude was contained.
Figure 26-7: US 3:2:1 Refining Margin vs WTI Crude (US$/bbl), 2026
Two refining systems were degraded at once, which is why the product side stayed tight long after crude cracked. Gulf refineries had cut runs or shut entirely when the strait closed, removing product supply at the source. At the same time, and for reasons unrelated to Hormuz, Ukraine’s long-range drone campaign against Russian refineries reached a record pace in the first half of 2026, with roughly 190 strikes, several times the prior year’s count and a monthly peak in May, knocking out large slices of Russian crude-processing and diesel output (see Chapter 7 (Refining)). Distillate, the tightest product globally and the one most exposed to both shocks, led the move: the diesel crack ran well above the gasoline crack for most of the crisis. The lesson for a policymaker is uncomfortable. Strategic reserves defend the crude price, and by extension the balance of payments and the macro shock, but they do very little for the price a driver or an airline actually pays, because that price is set one refining step further on, in a market no reserve can reach.
Anatomy of a Reopening
A strait reopens in the reverse order it closed, and far more slowly. Closure is a step change: the shooting starts, insurance vanishes overnight, and traffic falls to near zero within 48 hours. Reopening is a curve. It runs through a sequence of gates that clear one at a time, and a signed deal only opens the first of them. The chapter’s own timeline shows why: when Iran’s foreign ministry declared the strait “completely open” on April 17, the reopening lasted under 24 hours before its own navy fired on a tanker. A declaration is not a reopening. The gates are.
The shooting has to credibly stop, and stay stopped. Owners do not risk a $100 million hull and 2 million barrels of cargo on a ceasefire that has broken twice before. They wait for evidence the truce holds. The channel has to be cleared.Mines and unexploded ordnance do not disappear when a deal is signed; demining a waterway the width of Hormuz is a job measured in weeks, and a single drifting mine reverses confidence instantly. War-risk insurance has to re-rate down. This is the binding constraint on the way out, exactly as it was on the way in. Underwriters cut premiums slowly and only after a run of safe transits builds a track record; no policy, no sailing. And owners have to trust it enough to switch their AIS back onand route laden tankers through the strait rather than keep running dark or paying for the bypass pipelines. Each gate that clears lets a larger share of normal traffic return, so the recovery arrives as a rising percentage, not a reopening day: a thin trickle of cautious transits first, the bulk of volume over the following weeks as premiums fall, and full restoration of the roughly 20 Mbpd that normally passes lagging on the slowest gate, usually demining and the last holdout insurers, by a month or more. The 2026 reopening ran the pattern but compressed it: a thin, fragile rebound in the first days after the June 17 signing (71 transits over June 19 to 21, and a brief re-closure and fresh attacks in late June that briefly reversed confidence), then a fast completion once the truce held. The recovery did not return uniformly, and the composition matters. Oil and gas tankers came back first and fastest, because they carry the highest-value cargo and because Iran’s whole point of leverage was oil: by July 2, 35 tankers were clearing the strait in a day, back inside the pre-war band of 30 to 40. Total traffic of all ship types lagged well behind, roughly 258 transits in the week against 138 the week before but still far under the pre-war run rate of well over 100 vessels a day, because container ships and dry-bulk carriers can reroute around the Cape and were in no hurry to return to a strait that had been mined weeks earlier. The direction of the rebound was almost entirely eastbound and crude-heavy, laden VLCCs and Suezmaxes bound for Asia, where China and India alone take roughly 44% of Hormuz crude; the leading indicator that it would hold was the surge of empty tankers sailing back in ballast to reload (inbound ballast crossings up over 250%), a sign owners were betting on a sustained reopening rather than a one-off dash. That the gates cleared in weeks rather than the modeled month-plus is precisely what flipped the market from shortage to glut. The same logic governs the Red Sea, a separate chokepoint on its own clock, where repeated Houthi ceasefires have broken before insurers fully returned, leaving that route stuck half open long after the headlines moved on.
The 2026 Crisis: A Timeline
The crisis ran from February 28 to June 17, 2026, and moved through six phases: a near-total shutdown, a long armed stalemate, a fragile partial reopening, a standoff over a framework, the interim deal, struck June 14 and signed June 17, that ended the war, and a post-deal phase of boundary testing in which both sides probe the edges of the settlement while traffic normalizes and the market flips from shortage to glut. Contested figures are attributed to the claiming party; the live block at the top of this chapter carries the current status.
Table 26-3: Strait of Hormuz Crisis, February 28 to June 17, 2026
| Date | Event |
|---|---|
| Feb 28 | US and Israel launch Operation Epic Fury; Supreme Leader Khamenei killed. The IRGC Navy forbids passage on VHF Channel 16; Iran fires missiles and drones at US bases in the Gulf. Within 24 hours, three tankers are struck and incoming traffic collapses. |
| Mar 1-14 | 28-plus attacks on shipping; the tug Mussafah 2 sunk, 16 ships damaged. P&I clubs withdraw war-risk coverage (effective Mar 5); traffic falls to near zero. Houthis resume Red Sea attacks, closing the alternative route. |
| Mar 2-4 | Qatar halts LNG production (Mar 2) and declares force majeure (Mar 4); European gas roughly doubles in a week. |
| Mar 7-26 | Iran opens selective transit to friendly states (China's Iron Maiden on Mar 7; five nations by Mar 26), creating a two-tier market, and begins charging tolls above $1M per vessel north of Larak Island. |
| Mar 8-19 | Brent reaches $126 (Mar 8); Dubai hits $166 (Mar 19), the most expensive barrel of crude ever traded in nominal terms. |
| Mar 10-13 | Bypass pipelines activated (Petroline, Habshan-Fujairah); Saudi Arabia cuts 20%, Iraq declares force majeure; US intelligence confirms Iranian mine-laying. |
| Mar 11 | IEA members pledge a coordinated release of up to 400 million barrels, the largest ever. |
| Apr 8 | A temporary ceasefire is announced with provisions to reopen the strait. It is never implemented; ADNOC's CEO calls the strait “effectively closed.” |
| Apr 11-13 | US destroyers begin mine clearance (Apr 11); talks fail and Trump declares a naval blockade (Apr 12), then extends it to Iranian ports (Apr 13). Iran calls it “piracy.” |
| Apr 17-18 | On an Israel-Lebanon ceasefire, Iran's foreign ministry declares the strait “completely open”; WTI falls more than 9%. The reopening lasts under 24 hours: Iran's military fires on a tanker near Oman (Apr 18), contradicting its own diplomats. The US launches Operation Economic Fury to board Iran-linked vessels worldwide. |
| Apr 28-30 | The UAE quits OPEC+ (Apr 28); the two-week ceasefire expires unrenewed (Apr 29); Brent spikes to a four-year high of $126 intraday (Apr 30) on reports of US strike options. The IEA's Birol calls it the worst energy shock ever. |
| May 3-8 | US-led Project Freedom escorts neutral vessels, then pauses (May 3-6); counter-strikes follow (May 7-8). |
| May 10-15 | Iran sends a framework response (May 10); Trump rejects it (May 11), WTI near $100. A thin trickle of dark transits moves under fire; the cargo ship Haji Ali is sunk (May 13); roughly 600 tankers sit stranded in the Gulf. |
| May 20 | Three crude VLCCs transit eastbound on a fee basis south of Larak Island, the first material commercial transits since Project Freedom collapsed. |
| May 23-24 | Trump says a framework is “largely negotiated” (May 23): Iran reopens the strait and waives fees; the US lifts the blockade and unfreezes roughly $100B, 30 days to finalize. A day later he tells negotiators “not to rush.” |
| May 25-31 | The US sinks two IRGC mine-laying speedboats and strikes launchers after Iran fires SAMs (May 25); Trump rejects Iran's latest proposal (May 29); US warplanes hit Qeshm Island and Gorik after Iran downs an MQ-1 drone (May 31). 28 vessels transit on May 31, each paying a fee. |
| Jun 1-3 | Iran suspends all message exchanges with the US (Jun 1). The heaviest fighting since the pause follows, with Iranian strikes on US regional bases and Kuwait's main airport; Trump sets a red line, saying he will end the ceasefire only if Iran kills American troops (Jun 3). |
| Jun 8-13 | Back-channel talks resume through Omani and Qatari mediators. An Israeli strike on a Hezbollah convoy in Lebanon (Jun 11) nearly collapses the negotiation; Trump tells Israel to halt further Lebanon attacks. Polymarket odds that the US blockade is lifted by June 30 climb toward certainty. |
| Jun 14-15 | The US and Iran announce an interim peace deal (Jun 14), with signing expected within days. Terms: the strait reopens after mine clearance, with the US naval blockade and Iran's shipping restrictions lifted at once; a 60-day window opens to negotiate Iran's nuclear program; Iran gains access to billions in previously blocked funds and sanctions relief, with Trump stating the deal bars Iran from obtaining a nuclear weapon. Crude falls hard: WTI trades near $80.61, down $4.27 since Friday, from a crisis peak above $120. |
| Jun 17 | Trump signs the deal, a memorandum of understanding ending the war: Iran reopens the strait and the US lifts sanctions on Iranian oil sales. Tankers begin resuming and exporters such as Iraq prepare to lift shipments; with the risk premium drained, Brent falls to about $77.71 and WTI to $74.08, both down roughly 15% on the week (US crude stocks still fell 8.3M barrels). Saudi Aramco's chairman, Yasir Al-Rumayyan, says the company is weighing larger oil-storage facilities worldwide, citing China's and the US's strategic stockpiles as proof of the value of reserves during the disruption. |
| Jun 19-21 | Transits rebound but the recovery is fragile. MarineTraffic records 71 confirmed crossings over the three days, with a weekend peak of 35 on June 20, as more commercial ships transit with their AIS transponders on, a sign of returning confidence. Traffic stays below pre-crisis levels: demining is incomplete and many vessels still run dark or follow Iranian-hugging routes, and diplomatic uncertainty lingers. |
| Jun 20 | Iran briefly re-declares the strait closed, citing alleged Israeli violations of the Lebanon ceasefire; the rebound stalls for days before the truce holds. |
| Jun 25-27 | Fresh attacks despite the deal: the container ship Ever Lovely is damaged off Oman (Jun 25) and the IMO pauses evacuating some 11,000 stranded seafarers; the tanker Kiku is struck by what CENTCOM calls an Iranian drone (Jun 27), and the US answers with airstrikes on Iranian sites including Qeshm Island. The Joint Maritime Information Center opens a widened transit corridor near Oman, challenging Iran’s claimed control of the routes. |
| Jun 30-Jul 2 | Oil and gas tankers return to normal faster than any model expected: 35 clear the strait on July 2, back inside the pre-war band of 30 to 40 a day, the first return to normal for tankers since February. Total traffic of all ship types still lags, about 258 transits in the week (against 138 the week before) versus a pre-war run rate well above 100 vessels a day, as container and dry-bulk ships that can reroute around the Cape are slow to return. The rebound is eastbound and crude-heavy, laden VLCCs and Suezmaxes bound for Asia (China and India take roughly 44% of Hormuz crude), with empty tankers surging back in ballast to reload, the signal that the reopening will hold. The market flips from shortage to glut: Morgan Stanley cuts its Brent forecast to $75 (its second cut in two weeks) and Goldman follows, citing the fast Hormuz recovery, OPEC+ output hikes, and weak Chinese demand; WTI slips to the high $60s. |
| Jul 1-2 | US and Iranian diplomats meet mediators in Qatar and report “positive progress.” But Iran’s joint military command warns that tankers must use its approved routes or face a “forceful response,” insisting Tehran will direct traffic and eventually charge passage fees, a claim Washington and the Gulf states reject. The 60-day nuclear-negotiation window runs toward late August, with sanctions relief set to lapse on August 21 absent a deal. |
| Jul 7-8 | Post-deal boundary testing, not a reopening. Trump declares the ceasefire ended after the IRGC fires on commercial ships, and Iran keeps pressing its claim to direct traffic and levy tolls. Both are read as probing the edges of the June 17 settlement rather than reversing it: the strait stays open, tanker traffic keeps normalizing through the noise, and crude holds near $70 on glut fears. |
The Standing Lessons
The 2026 crisis is over, but its durable lessons outlast the settlement that closed it, and they are already clear.
- The Hormuz premium is permanent. The demonstrated willingness and capability to close the strait changes the risk calculus for every barrel of Gulf crude. A tail risk the market priced near zero is now a proven event. War-risk premiums on Hormuz transit will stay elevated for years, the forward curve for Gulf grades will carry a structural premium over Atlantic-basin crude, and every long-term Gulf supply contract will be rewritten with force-majeure language that reflects what happened. That the spot price collapsed within weeks of the reopening, flipping the market from shortage to glut, does not undo this: the durable premium sits in the insurance rate and the risk layer of the forward curve, not in the front-month barrel, which is once again governed by the OPEC+ output cycle and Chinese demand.
- Mine warfare is cheap and decisive. A naval mine costs $10,000 to $25,000; a VLCC costs $100 million or more. Iran planted roughly a dozen mines by mid-March and by early April had lost track of some of them, meaning it could not guarantee safe passage even if it wanted to. Mines cannot be intercepted like missiles; they sit and wait, and clearing a six-mile lane takes weeks under fire. A mid-tier power closed the world's most important chokepoint against the world's most powerful navy. That lesson will not be lost on any state that controls a narrow waterway: Turkey, Egypt, Malaysia, Indonesia.
- Bypass pipelines are necessary but insufficient, and more are now inevitable. The existing lines moved 7 to 9 Mbpd, less than half of normal Hormuz transit, and they worked only because Saudi Arabia kept the Petroline partially loaded as a strategic option. Closing the full 13 Mbpd gap would cost an estimated $40 to $65 billion in crude pipelines over 3 to 5 years. The hard problem is LNG, which cannot be pipelined: making Qatar's Hormuz-dependent 80 Mtpa export complex independent would mean a new liquefaction plant on the Red Sea or Omani coast, $100 to $145 billion over 7 to 10 years.
- Strategic reserves bought time, but the buffer is thin and finite. The 400-million-barrel IEA commitment is about four days of global consumption, and actual draws have run well below the headline pace. The US SPR, already down from its 727-million-barrel 2010 peak, is approaching its 2022-23 post-Ukraine trough. Reserves are designed for short disruptions, not a multi-month blockade of the world's most important chokepoint.
- The real buffer is invisible. The reason the price held below $200 is mostly the AI-driven inventory efficiency described above, close to a billion barrels of structural slack that did not exist a decade ago. It is the most important and least discussed change in how the oil system absorbs shocks, and it does not show up in any inventory report.
- $100-plus oil unlocks supply, but slowly.The most responsive source is US tight oil, profitable in every basin above $100, but the full supply response to a sustained signal takes 12 to 24 months. The market priced a quick resolution throughout, holding front-month WTI below $130 even at the worst of the closure, and the June 14 deal vindicated that bet: crude fell back toward $80 within hours. Had the talks failed once more, the forward curve would have repriced upward and unlocked a wave of US drilling adding 1 to 2 Mbpd within 18 months, the pattern after every price spike since 2010. The settlement’s sanctions relief now points the other way, with the prospect of 1 to 2 Mbpd of returning Iranian supply over several years structurally depressing long-dated prices.
- The consumer hit is immediate and regressive, and it caught airlines under-hedged. Pump prices move within days: US retail gasoline crossed $4.50 by mid-March and $5.00 in some states by April, with diesel rising faster as Gulf refinery shutdowns tightened products. After years of stable jet fuel, most US carriers had wound down their hedge books, and they absorbed the spike in full. The contrast between Ryanair (heavily hedged, outside the conflict zone, profitable on its fuel book) and Emirates (unhedged, hub inside the crisis) is the clearest illustration of what hedging is for (see Chapter 20 (Risk Management)).
Figure 26-8: US Airline Fuel Hedging: % of Next-12-Month Consumption Hedged
Sources: SEC 10-K filings (LUV, DAL, UAL, AAL, JBLU, ALK), Southwest 50th anniversary disclosure, DWU Consulting, Skift. These seven carriers account for roughly 90% of US jet fuel consumption.
By 2025, all seven major US carriers had exited financial fuel hedging. Southwest, which saved $3.5 billion from hedges between 1998 and 2008, discontinued its programme in December 2024. Delta replaced financial hedges with its Trainer refinery in 2012. United and American exited after large hedge losses in 2008 and 2009. JetBlue, once a moderate hedger at roughly 28% in 2010, wound down to zero by 2024. Alaska Airlines, which hedged 50% of its fuel in early 2022, suspended its programme in 2023. Spirit and Frontier, both ultra-low-cost carriers operating on razor-thin margins, never hedged meaningfully. When jet fuel spiked above $170 per barrel equivalent in March 2026, no US carrier held meaningful hedge protection. - Oil is China's central strategic weakness. China imports roughly 11 Mbpd of crude, 40% through Hormuz, and its 500-to-600-million-barrel reserve covers 80 to 90 days, designed for a short disruption, not a sustained closure. With Venezuelan supply having collapsed in January and Iran now at the center of the crisis, China's industrial base, military logistics, and diesel-powered food system all depend on oil that must cross either Hormuz or Malacca. Import dependence is the structural constraint on Chinese power projection, and Beijing knows it.
- Shut-in capacity may not all come back. Oil wells are not faucets. Fields on decades-long waterflood, Ghawar, Safaniya, Burgan, Rumaila, risk permanent damage from prolonged shut-in as the flood front destabilizes. Days restart easily; weeks may need a workover; months may need re-drilling. This crisis ran roughly three and a half months, well past the threshold where damage stops being hypothetical: permanent regional losses of 0.5 to 1.0 Mbpd from reservoir damage alone are now a live risk, and the post-reopening ramp will reveal over the coming months how much of the shut-in capacity actually returns. The reopening is the start of that test, not the end of it.
- The lasting legacy may be a global race to build reserves. The clearest structural outcome is a worldwide rethink of strategic storage. Days after the deal, Saudi Aramco signaled it would weigh far larger storage abroad, and the same logic now runs through the import-dependent world: China, which had quietly built the largest stockpile on earth at more than a billion barrels and cut its crude buying by over a third during the war, came through almost untouched, while India, with roughly nine days of dedicated cover, did not. India has ordered an expansion, and Pakistan, Australia, and Singapore are reported to be building or enlarging reserves. The Reuters columnist Ron Bousso estimates the drawn barrels plus the new buildout add up to on the order of a billion barrels of fresh demand, enough to support prices for years even though the IEA still expects a large supply surplus as Gulf output returns. The deeper shift is one of philosophy: a decade spent running oil supply chains "just in time" gives way to holding oil "just in case," with all the cost, and the standing bid, that implies.
The Strait of Hormuz crisis of 2026 proved what oil traders had modeled for decades but never expected to see: the world's most important oil chokepoint can be closed, the closure can persist for months, and no navy on earth can reopen it quickly against a determined adversary with mines, missiles, and drone boats. It took a negotiated settlement, not a military one, to reopen the strait, after sixteen weeks that brought net oil-importer reserves within three weeks of exhaustion. The premium that closure revealed does not disappear with the deal; it is now a permanent feature of every Gulf barrel.