Chapter 1
A Brief History of Oil
History of the oil industry from 1859 to 2026: Drake's well, Standard Oil, OPEC, oil shocks, shale revolution, and the modern era.
1859 to 1911: A New Industry
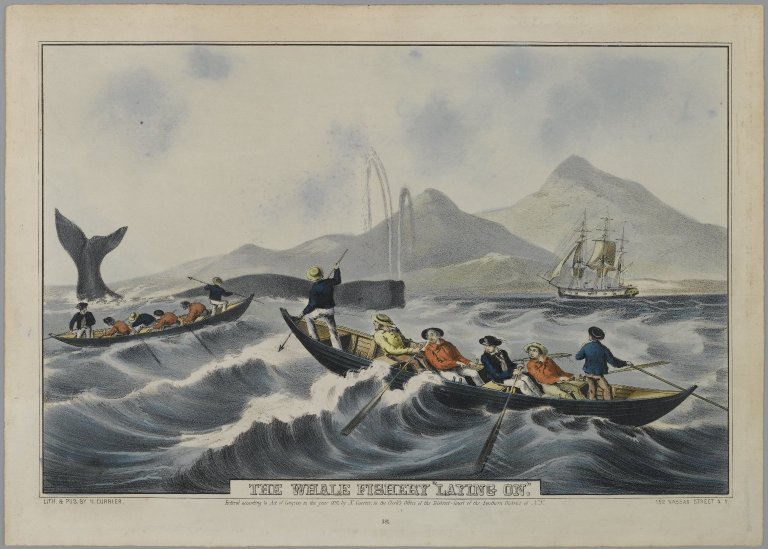
The modern oil industry began as a result of a scarcity of whales. Through every age of civilization, artificial light has been the tool people have used to free themselves from their dependency on daylight. Until 1859, most of the world obtained light by burning animal fats: tallow candles, beeswax candles, and whale oil. Whale oil shed the purest light of all available fuels and became a luxury product. Overfishing drove the whale population down and the price of whale oil up, and the search for a cheap replacement was on.
People have used oil obtained from the ground since at least 4,000 BC. In the Middle East, crude oil that seeped to the surface was used to waterproof boats and as an adhesive in building construction. Crude was refined in minor quantities for lamp oil in China around 1,000 BC, though the technology did not survive into the modern era. By 600 AD, the Byzantines used crude oil to produce a flame-throwing naval weapon called Greek fire. But none of this was an industry. It was opportunistic use of surface seeps.
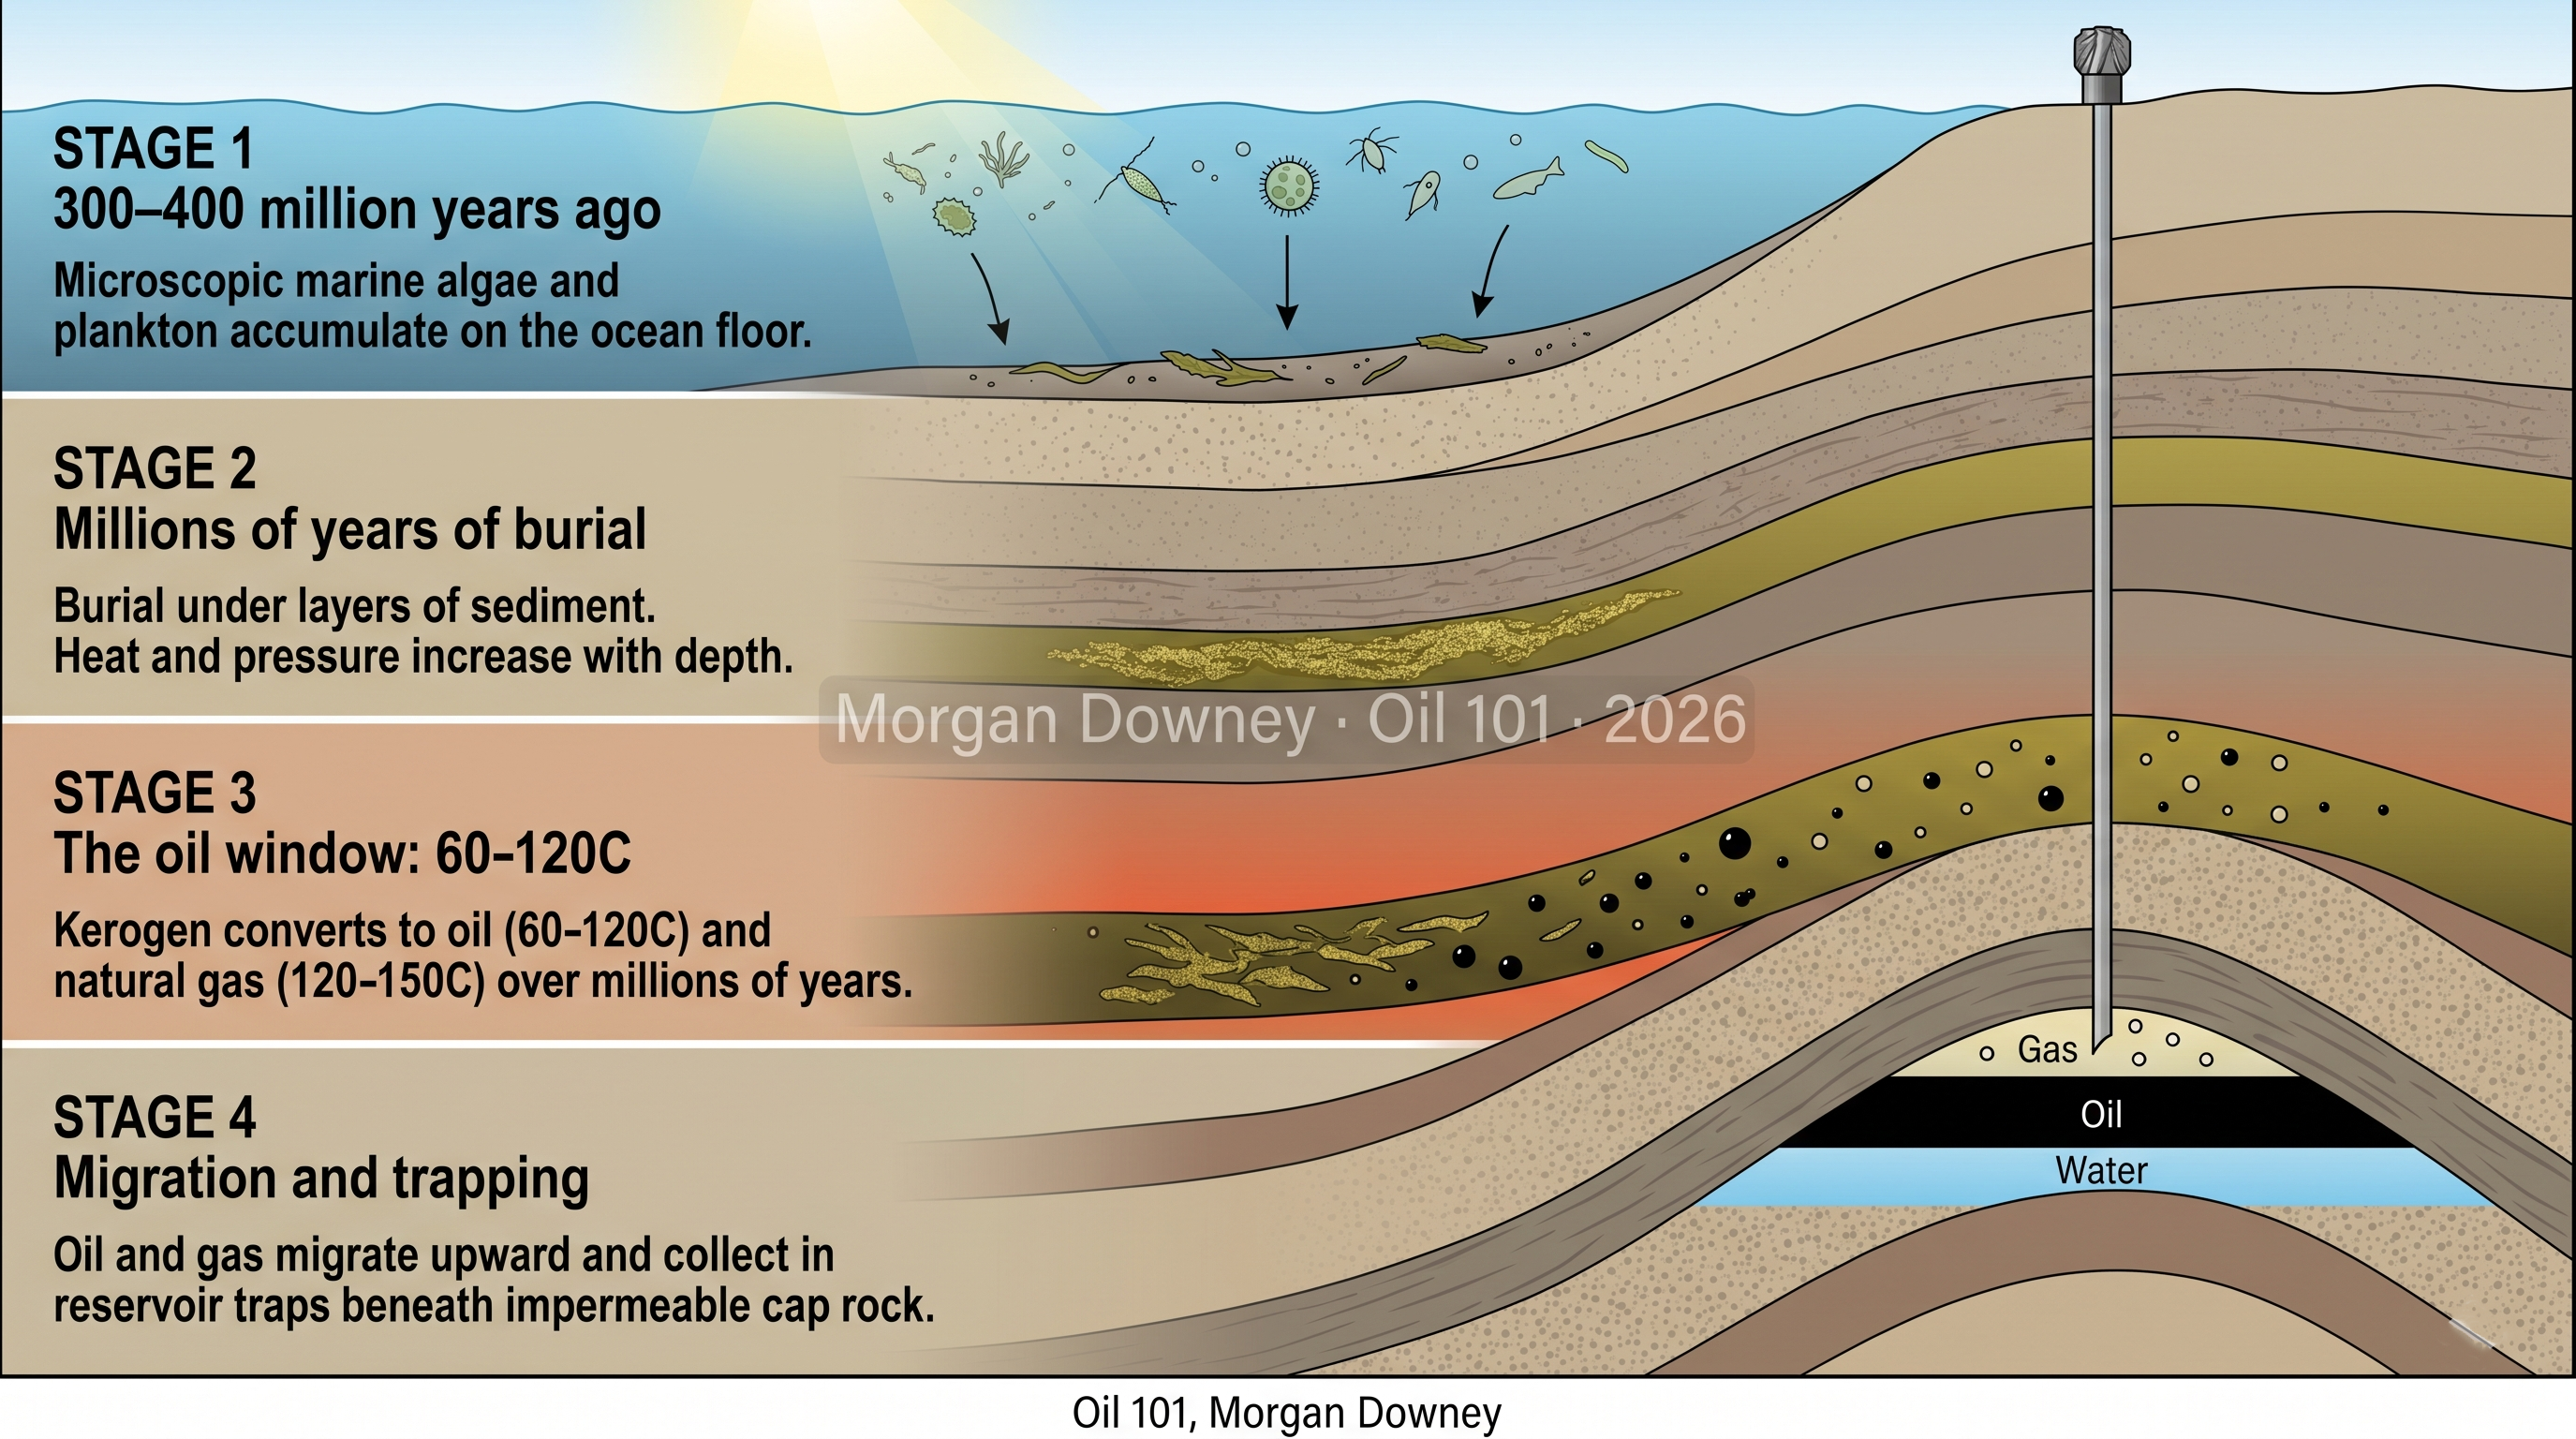
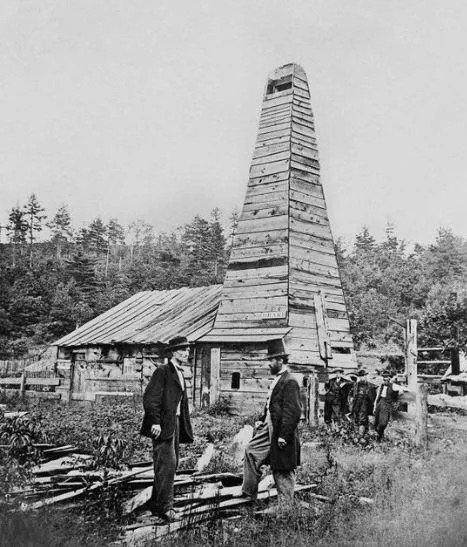
In the 1840s, a Pennsylvania salt miner named Samuel Kier noticed that his salt wells were fouled at the surface by an oily liquid. After seeing Seneca Indians use the oil as a liniment, Kier decided to commercially market the waste product as medicinal Seneca Oil or Rock Oil. In 1854, George Bissell and his business partners sent a sample of rock oil, skimmed from a surface pool in northwestern Pennsylvania, to Professor Benjamin Silliman of Yale University. Silliman confirmed that the sample could be distilled into a lamp fuel, later called kerosene. Bissell raised capital for the Pennsylvania Rock Oil Company and hired a railroad conductor named Edwin Drake to drill. Drake had no military background; his colonel's title was invented by the company to impress the locals. On August 27, 1859, at Titusville, Drake struck oil at 69 feet. The well produced 15 barrels a day, and the modern oil industry began.
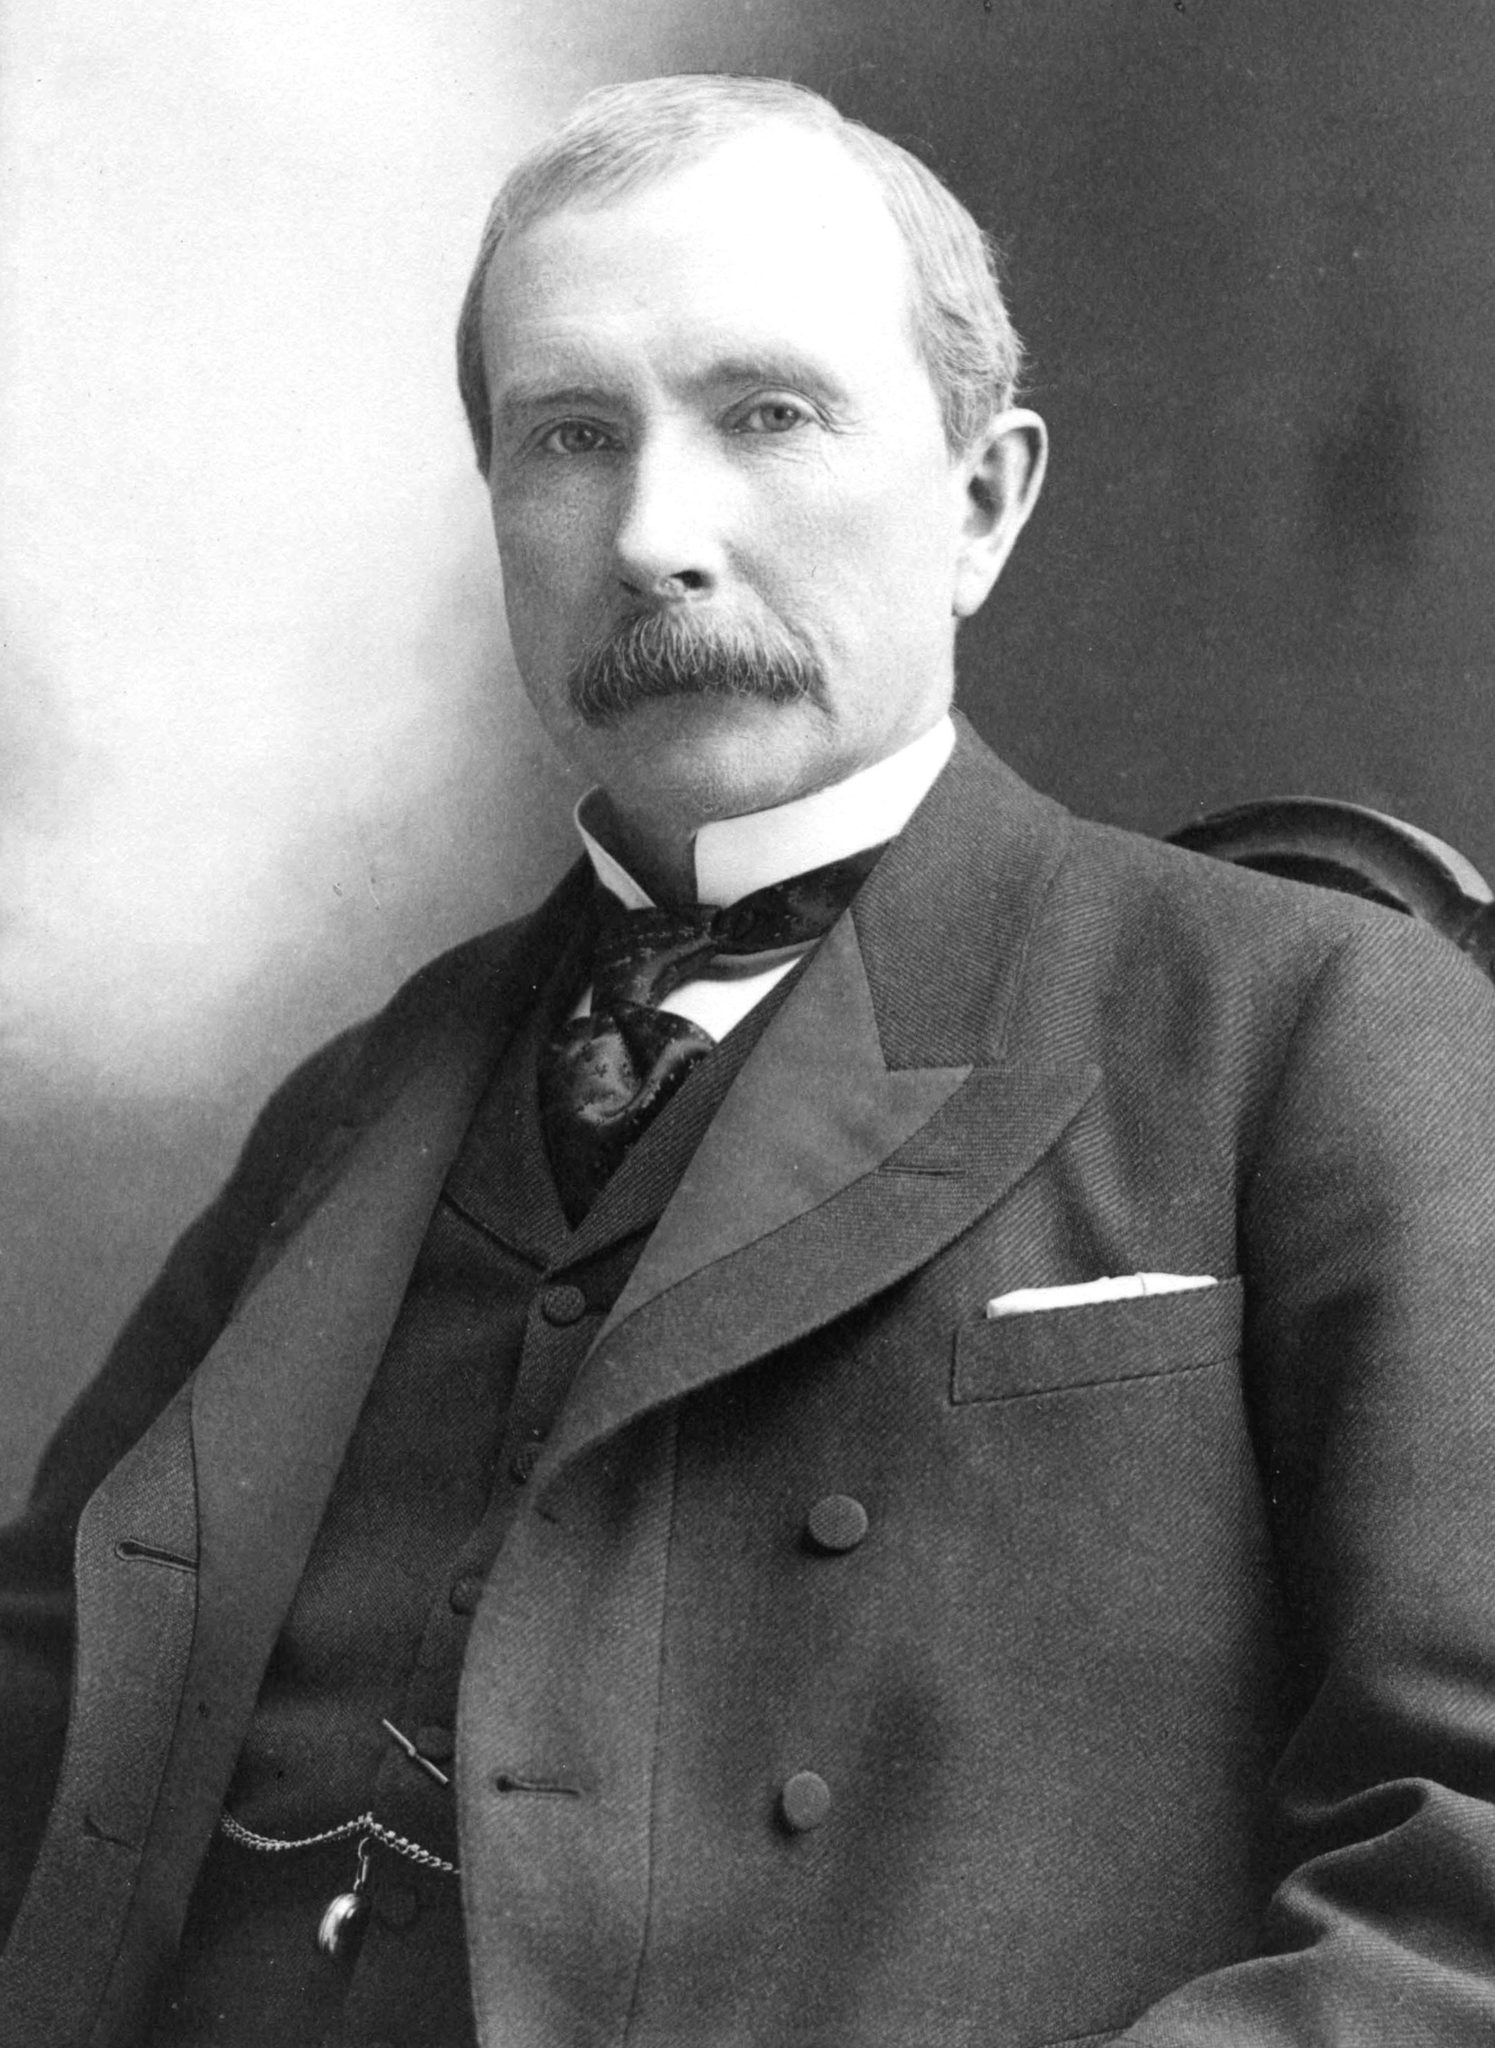
Within months, every farmer in Pennsylvania was drilling. Overproduction collapsed the price from $18 a barrel in January 1860 to ten cents by the end of 1861. It was the first of many boom-and-bust cycles that would shape the industry for the next 160 years. Out of this chaos emerged John D. Rockefeller and the Standard Oil Company, founded in 1870. By 1890, Standard Oil controlled 90% of US refining through a combination of ruthless price discipline, rebate deals with railroads, and relentless vertical integration. In 1911, the Supreme Court used the Sherman Antitrust Act to break Standard Oil into 34 separate companies. Three of those pieces eventually became ExxonMobil, Chevron, and ConocoPhillips. The 34-way breakup was also, indirectly, the origin of the modern US equities market: Standard Oil shareholders received a fractional share of each of the 34 companies, and the public market for those fragments had to be built from scratch.
Although whiskey and wine barrels were only briefly used to transport oil, the word barrel stuck. Standard Oil standardized the volume at 42 US gallons: two extra gallons over the 40-gallon whiskey barrel, to allow for evaporation and leakage during shipment. That 42 gallon barrel is still the unit of the modern oil market.
International Origins: Baku, Persia, and Sumatra
The Pennsylvania story dominates most histories, but international oil has parallel origins. The oldest oil region in the world is around Baku, on the Caspian Sea in what is now Azerbaijan. Oil had seeped to the surface there for centuries, and primitive hand-dug wells supplied local markets as early as the 1840s. In 1872, the Russian empire opened Baku to private investment, and by 1900 the region produced half of the world's oil. The Nobel brothers (yes, those Nobels) and the Rothschilds built competing oil empires there. The Nobel family fortune, which funds the Nobel Prizes, came in large part from Caspian oil.
In 1908, after years of hunting, William Knox D'Arcy's geologists struck oil at Masjed Soleyman in southwestern Persia. The Anglo-Persian Oil Company was formed the following year to develop the concession; the British government would take a majority stake in it only in 1914, on the eve of war, as described below. Anglo-Persian later renamed itself Anglo-Iranian, then British Petroleum, then BP. Persia was the first strategic oil discovery of the twentieth century, and it tied British military and foreign policy to the Middle East in ways that would define the next century.
In the Dutch East Indies, a tobacco planter named Aeilko Zijlker noticed an oily sheen on a leaf at Telaga Tiga in Sumatra in 1880. The discovery well drilled there in 1885 led to the founding of the Royal Dutch Company, which in 1907 merged with the UK-based Shell Transport and Trading to form Royal Dutch Shell. By 1911, when Standard Oil was broken up, three of the major international oil companies (Anglo-Persian, Royal Dutch Shell, and the Standard Oil successor companies) were already in place. Together with Gulf Oil, Texaco, and two other Standard offspring, they would become the Seven Sisters that dominated the industry for the next sixty years.
World War I and the Navy Switch to Oil
Before 1914, oil was primarily a lamp fuel and a lubricant. That changed during the run-up to the First World War. Winston Churchill, as First Lord of the Admiralty, decided in 1911 to convert the Royal Navy from coal-fired to oil-fired propulsion. Oil burned hotter, took up less space, could be moved between bunkers without shoveling, and gave British battleships a decisive speed advantage over the coal-fired German fleet. The catch was that Britain had plenty of coal but almost no oil. To secure supply, the British government took a 51% stake in the Anglo-Persian Oil Company in 1914, just weeks before war broke out. The decision tied British strategic policy to Middle Eastern oil and made clear, for the first time, that oil was no longer just a commodity. It was a war-winning input.
The war itself proved the point. Allied tanks, trucks, ships, and aircraft ran on gasoline and diesel. At the Paris Peace Conference, the French Senator Henri Bérenger summed it up: "Oil, the blood of the earth, was the blood of victory." The Wright brothers had flown on gasoline in 1903, and by 1918 military aviation was a core part of every major army. The modern oil industry's transition from lamp oil to transport fuel was complete.
The Texas Railroad Commission and Achnacarry
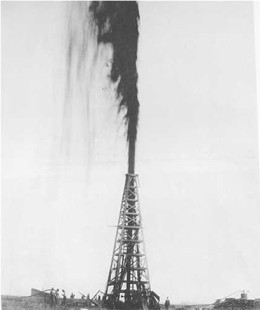
Between the two world wars, the oil industry had a structural problem: too much oil. New fields were being found faster than demand could absorb them. The 1901 Spindletop discovery near Beaumont had started the Texas boom. Over the next three decades, giant fields in East Texas, Oklahoma, and California turned the US into the world's largest producer and chronic oversupplier. Prices crashed repeatedly. In 1928, the heads of the most powerful international oil companies met for a grouse shoot at Achnacarry Castle in Scotland and signed the As-Is Agreement: the oilmen agreed not to compete against each other outside the US and to keep each other's global market shares frozen in place. The agreement was the prototype for every subsequent oil producer cartel. It eventually failed because the signatories did not control enough of the market to enforce it.
In the US, the problem was solved differently. In 1930, a wildcatter named Dad Joiner discovered the East Texas field, the largest US oil discovery of its time. The resulting gusher glut collapsed prices to ten cents a barrel. The Texas Railroad Commission (TRC), originally created to regulate railroads, was given authority to impose production restrictions on Texas oil wells, ostensibly to prevent physical waste. For the next 40 years, the TRC effectively set the world oil price by adjusting allowable Texas production. Its control of spare capacity made it the arbiter of global oil pricing from 1931 through 1971. The OPEC model of managing spare capacity was, in its structural essentials, a direct copy of the TRC model.
The Seven Sisters and OPEC's Founding
Outside the US, international oil was dominated by the Seven Sisters, the Western oil majors that emerged from Standard Oil, Royal Dutch Shell, and Anglo-Persian. They held long-term concessions with producing nations, typically on a 50/50 profit-sharing basis, and operated as a de facto cartel. The table below shows the original Seven Sisters and their post-merger descendants.
Table 1-1: The Seven Sisters and their modern descendants
| Seven Sister (original) | Origin | Modern descendant |
|---|---|---|
| Standard Oil of New Jersey (Esso, Exxon) | 1911 Standard breakup | ExxonMobil |
| Standard Oil of New York (Socony, Mobil) | 1911 Standard breakup | ExxonMobil |
| Standard Oil of California (SoCal, Chevron) | 1911 Standard breakup | Chevron |
| Gulf Oil | Pittsburgh, Spindletop era | Chevron (1984 merger) |
| Texaco | Texas, 1902 | Chevron (2001 merger) |
| Royal Dutch Shell | Dutch East Indies + UK, 1907 | Shell plc |
| Anglo-Persian Oil Company | Persia, 1908 | BP |
OPEC, the Organization of the Petroleum Exporting Countries, was founded on September 14, 1960 in Baghdad by five producing nations tired of watching the Seven Sisters set the posted price of their oil without consulting them. The five founders were Iran, Iraq, Kuwait, Saudi Arabia, and Venezuela. The Venezuelan oil minister Juan Pablo Pérez Alfonzo was the intellectual architect of the alliance, having studied the TRC model closely. OPEC's founding charter borrowed the TRC's language of production prorationing almost verbatim.
Table 1-2: OPEC founding members, 1960
| OPEC founding member (1960) | Joined |
|---|---|
| Iran | September 1960 |
| Iraq | September 1960 |
| Kuwait | September 1960 |
| Saudi Arabia | September 1960 |
| Venezuela | September 1960 |
During the 1960s, OPEC had little pricing power. Western majors still controlled production and the TRC still controlled global pricing. That changed in 1970 when US oil production peaked and began to decline. Suddenly the US had no spare capacity to bring online, and the TRC's pricing role passed, almost literally overnight, to OPEC.
Mossadegh, the Abadan Crisis, and the 1953 Coup
In 1951, Iran's democratically elected Prime Minister Mohammad Mossadegh nationalized the Anglo-Iranian Oil Company (later BP), which had controlled Iranian oil since the 1908 Persia discovery. Britain responded with a worldwide boycott of Iranian oil, blockading the Abadan refinery (then the world's largest). Iranian oil production collapsed from 666,000 barrels per day in 1950 to almost nothing in 1952. In August 1953, a joint CIA-MI6 operation codenamed Ajax overthrew Mossadegh and restored the Shah to power. A new consortium of Western oil companies (Anglo-Iranian, Shell, the four American majors, and the French CFP) took over Iranian production under a 40% profit-sharing split with Iran. The coup secured Western access to Iranian oil for another 25 years, but it also poisoned the US-Iran relationship permanently and set the stage for the 1979 revolution.
Enrico Mattei and the 25/75 Break
In 1957, Enrico Mattei, the head of the Italian state oil company ENI, broke the Seven Sisters' 50/50 profit-sharing formula by offering Iran a 25/75 split in Iran's favor. Mattei understood that the 50/50 formula was an artifact of cartel discipline, not a law of nature, and that a hungrier outsider could undercut it. The Sisters were furious. Every producing nation immediately demanded 25/75 terms of its own. The 25/75 break was the first crack in the Western oil majors' pricing power and the philosophical foundation for OPEC three years later. Mattei died in a suspicious plane crash near Milan in 1962. The crash was ruled an accident for decades; an Italian investigation in 1997 found that the wreckage showed clear evidence of sabotage.
1971: The Tehran Agreement and the Nixon Gold Standard
Two events in 1971, three months apart, reset the entire oil system. In February, OPEC negotiators met with Western oil companies in Tehran and demanded a posted-price increase of 35 cents per barrel, along with the right to unilaterally revise posted prices over the life of the agreement. The Tehran Agreement was the first time producing nations dictated terms to the Seven Sisters, rather than the other way around. In August, President Nixon closed the gold window and effectively ended the Bretton Woods system. The US dollar, in which all international oil was priced, was no longer convertible to gold at a fixed rate. Over the next 18 months, the dollar depreciated sharply against every major currency. OPEC producers, who received dollars for their oil and spent them in Europe and Japan, watched their real purchasing power drop in lockstep. By 1973, OPEC members were explicitly linking their demands for oil price increases to the dollar's decline against gold and against the deutsche mark. The 1973 Arab oil embargo, when it came, was partly a geopolitical response to the Yom Kippur War and partly a monetary response to the end of Bretton Woods.
Oil Statistics (2024)
World Production (Total Liquids)
World Consumption
Largest Net Importers
Proved Reserves
Refining Capacity
Consumption per Capita
| Region | Bbl/person/yr |
|---|---|
| US | 22.1 |
| Europe (EU) | 10.2 |
| Global average | 4.7 |
| China | 4.3 |
| India | 1.4 |
Low US population density means public transport is not common.
The Oil Shocks and Demand Destruction
On October 16, 1973, Arab OPEC members imposed an oil embargo against the US and the Netherlands in response to Western support for Israel in the Yom Kippur War. The embargo cut world supply by five to ten percent almost overnight. The price of crude rose fourfold, from around $3 to around $12 per barrel, between October 1973 and January 1974. It was the first and only time the Arab oil weapon has been used. The second oil shock followed in 1978 to 1981. The Iranian revolution, the overthrow of the Shah, the US embassy hostage crisis, and the Iran-Iraq war pushed crude to over $38 per barrel by 1980, which was over $140 in 2025 dollars. US oil spending climbed to over 8% of GDP.
The oil shocks introduced a concept that economists still debate today: demand destruction. When the share of GDP spent on oil exceeds roughly 4%, economies enter recession and oil demand collapses. The 1973-74 shock pushed the US over 6% of GDP; the 1979-81 shock pushed it over 8%. Both coincided with severe US recessions. The 2008 oil spike pushed the share over 6% again and contributed to the financial crisis. The 4% rule is a rough early-warning indicator rather than a precise one: if oil consumption as a share of GDP is climbing through 4%, the market is destabilizing.
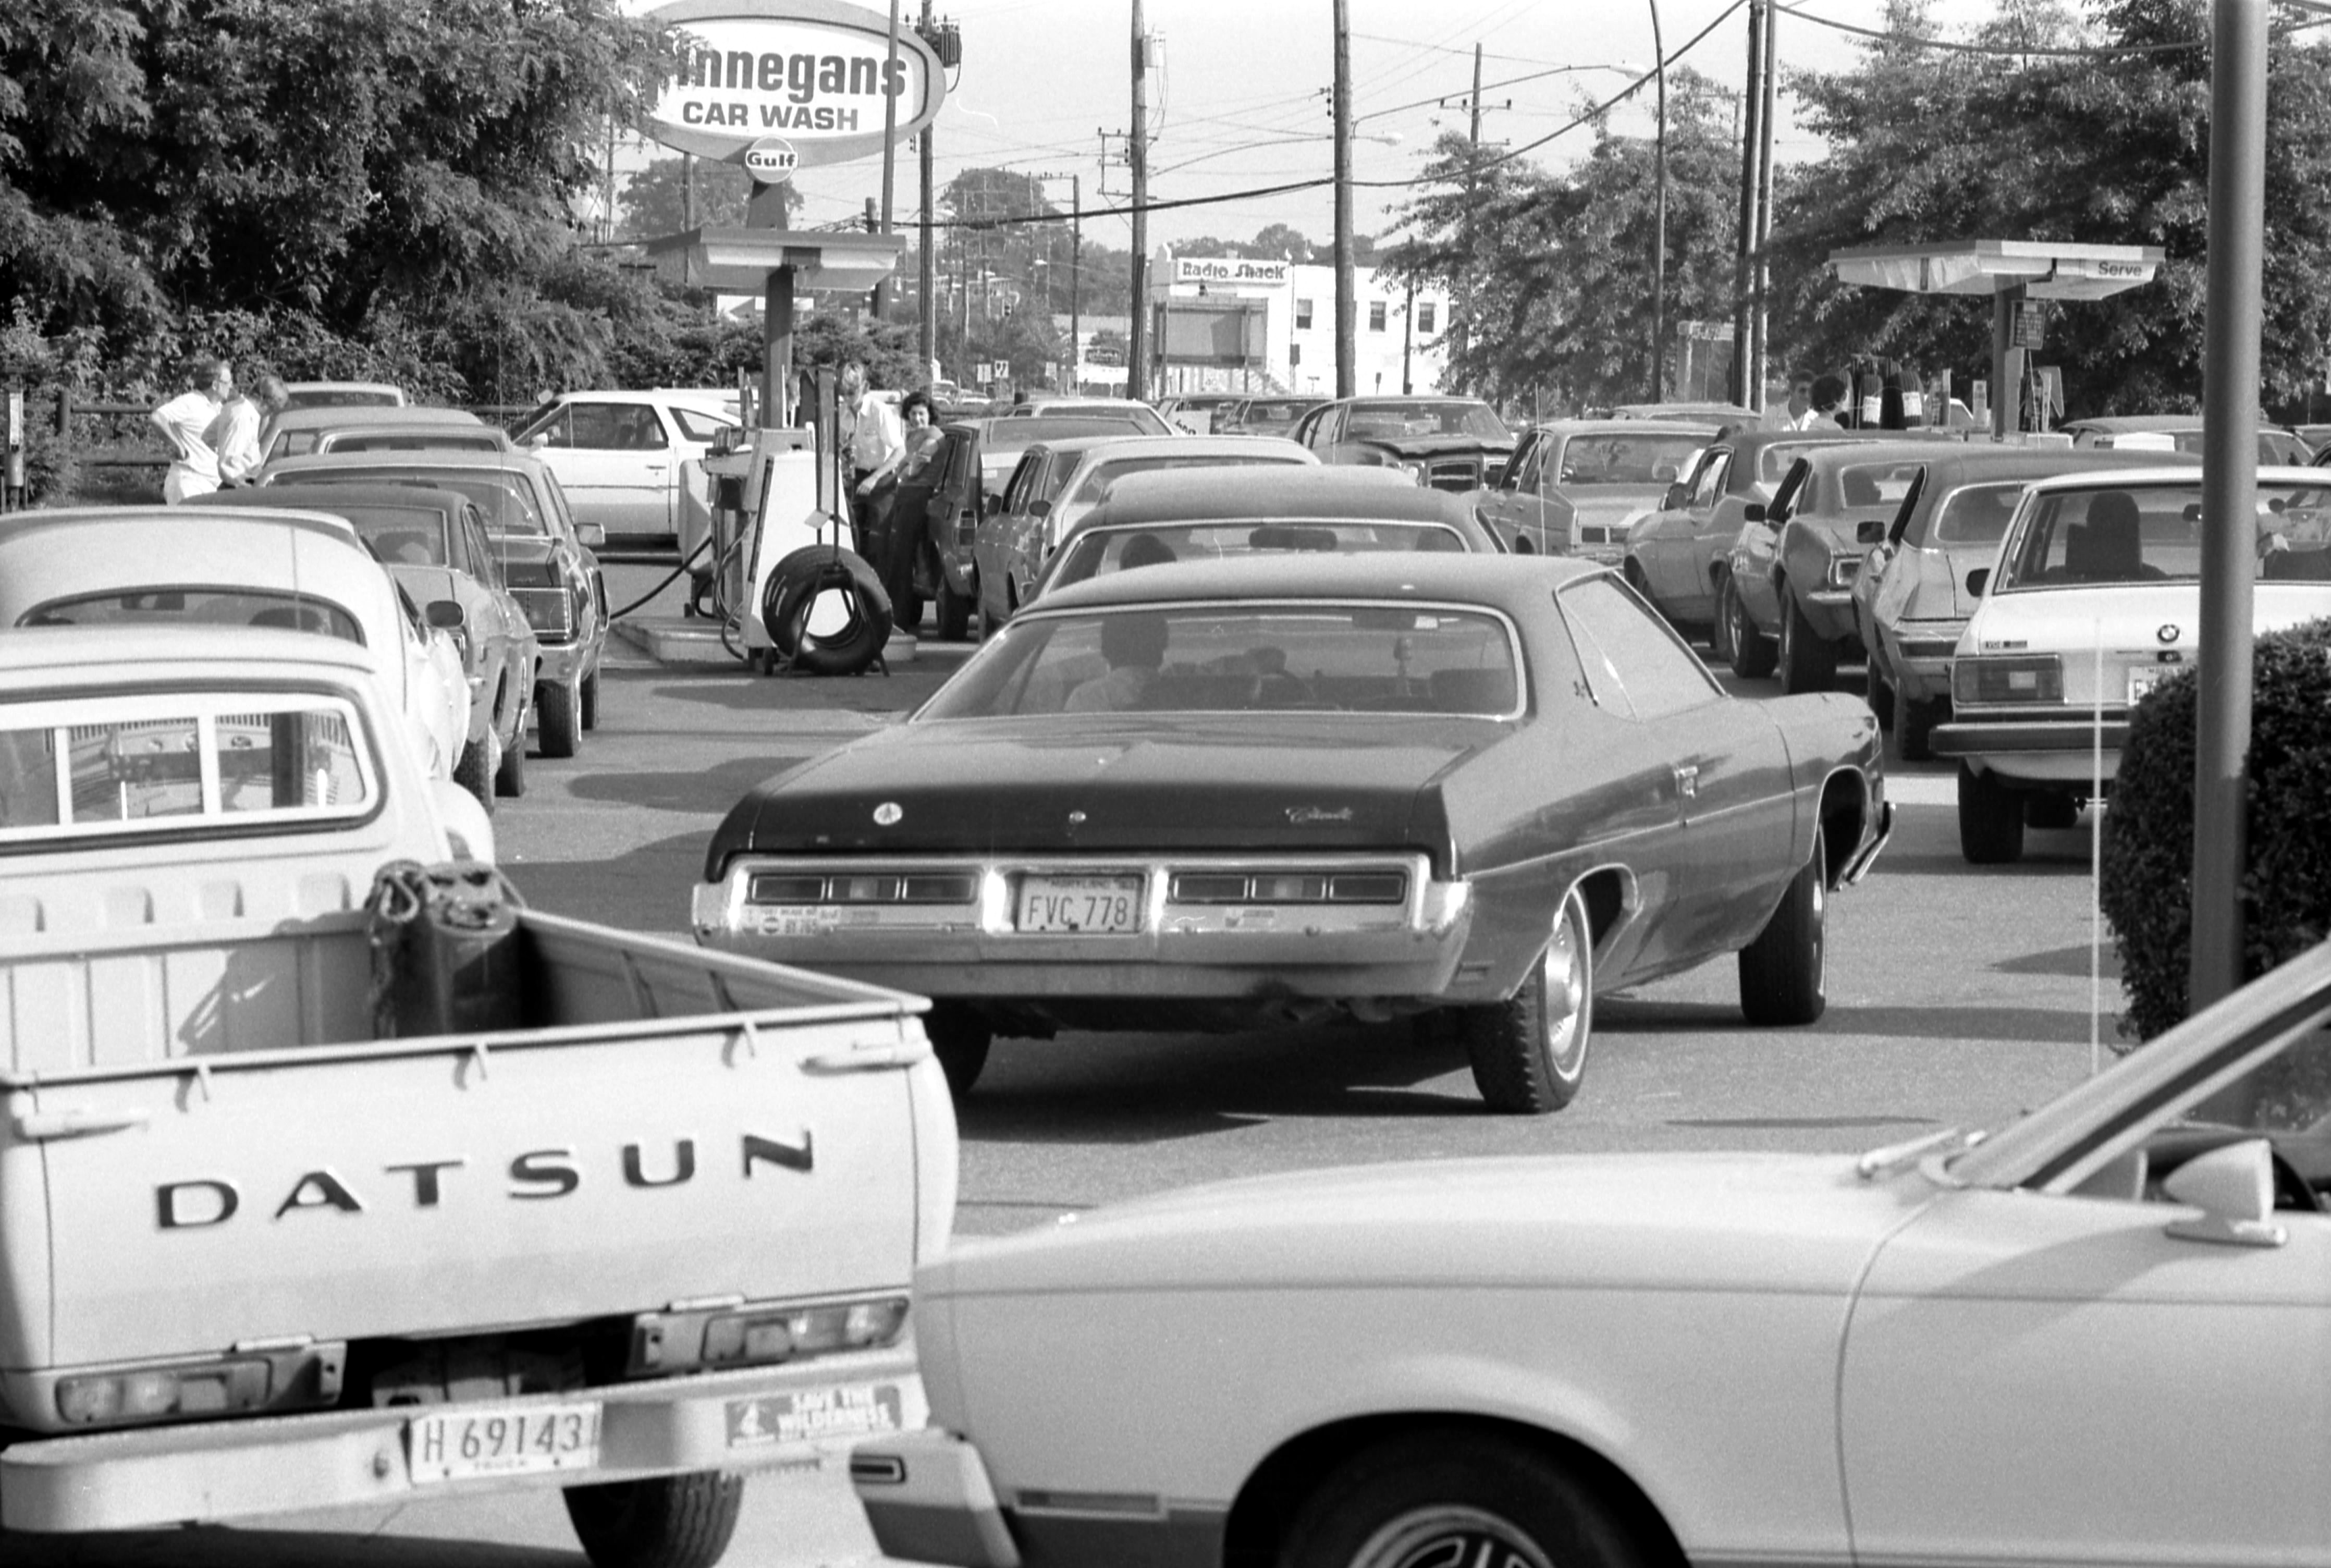
The nationalization of oil resources accelerated through the 1970s. The International Energy Agency (IEA) was formed in 1974 to coordinate Western consumer country responses. President Gerald Ford established the US Strategic Petroleum Reserve in 1975. Contrary to popular perception, there was no global physical shortage during the 1970s shocks. Price controls in individual consumer countries created artificial localized shortages, which were the gas station lines everyone remembers.
NYMEX, Formula Pricing, and the 1986 Counter-Shock
Before the 1970s, oil traded almost entirely on long-term contracts at posted prices. Spot trading and hedging as we now know them did not exist. The oil shocks changed that. In 1978, heating oil futures began trading on the New York Mercantile Exchange (NYMEX). Gasoline futures followed in 1981 and crude oil futures in 1983. WTI futures on NYMEX quickly became the global benchmark for light sweet crude. For the first time, a transparent, public, forward-looking oil price existed, and every producer and consumer had to adapt.
The other innovation of the 1980s was formula netback pricing. Instead of quoting a fixed price for a grade of crude, producers priced their oil against a benchmark (Brent, WTI, or Dubai) plus or minus an adjustment for quality and location. Formula pricing is still the dominant way physical crude is traded today and is covered in Chapter 17 (Oil Prices).
By 1985, Saudi Arabia was the only OPEC member honoring its quota. Production had been cut from 10.5 million barrels per day to 2 million barrels per day to support cartel prices, while other members cheated openly. In August 1985, the Saudis ran out of patience and announced they would move to formula netback pricing and rebuild market share. Production rose to 5 million barrels per day, and within a year oil prices collapsed more than 70%, from $30 to under $10. The 1986 counter-shock effectively bankrupted the Soviet Union (whose economy depended on oil revenue) and nearly bankrupted the US oil industry. It also opened the long low-price era that lasted until 2003.
Figure 1-10: Annual Average WTI (or Equivalent), 1970-2026
1990 to 2008: Low Prices, Asian Crisis, and the Supercycle
Iraq's invasion of Kuwait in August 1990 briefly doubled oil prices. The First Gulf War was short, and prices settled back. For most of the 1990s, oil was cheap. The 1997 Asian financial crisis, which started in Thailand and cascaded through Korea, Indonesia, and Russia, crushed Asian oil demand just as OPEC members were expanding production. By December 1998, WTI traded at $10.72 per barrel, the lowest inflation-adjusted price in half a century. OPEC responded with a coordinated production cut in early 1999, and the next decade told a completely different story.
From 2003 to 2008, Chinese demand growth, sustained by a construction and infrastructure boom, pushed oil prices from $25 to a peak of over $140 per barrel in July 2008. It was the longest and steepest oil price rally in modern history. By 2005, demand had finally caught up with OPEC's 35-year buffer of spare capacity. For the first time since the 1860s, there was effectively no cushion against an unexpected supply outage. The 2008 financial crisis ended the rally abruptly. Prices collapsed from $147 in July to $32 by December, a move that broke several major banks and at least one hedge fund.
Figure 1-11: Global Oil Demand by Region, 1965 to 2025 (Million Barrels per Day)
Sources: IEA, EIA, Energy Institute Statistical Review of World Energy
In 1930, we found 10 billion new barrels of oil in the world, and we used 1.5 billion. We reached a peak in 1964, when we found 48 billion barrels and used roughly 12 billion. In 1988, we found 23 billion barrels and used 23 billion barrels. In 2007, we found perhaps 6 to 7 billion, and we used 31 billion.
2009 to 2026: The Shale Revolution, OPEC+, and Negative Oil
The sections below are new to the 2nd edition, covering events since the original publication.
Since the first edition of Oil 101 in 2009, the industry has been reshaped more than in any period since the 1970s. The US shale revolution, covered in Chapter 21 (Shale Revolution), combined horizontal drilling, hydraulic fracturing, and just-in-time operational learning to turn the world's largest oil importer into the world's largest producer. US crude output rose from 5 million barrels per day in 2008 to over 13 million by 2024. The US crude export ban, in place since 1975, was lifted in December 2015, and by 2023 the US exported 4 million barrels per day of crude and another 6 million of refined products.
OPEC was forced to adapt. In 2016, OPEC partnered with Russia and nine other non-member producers to form OPEC+, the broadest supply-management agreement in oil market history. The alliance has managed production cuts and increases through multiple crises. Its biggest test came in April 2020, when the COVID demand collapse met a brief Saudi-Russia price war. On April 20, 2020, the front-month WTI futures contract settled at negative $37.63 per barrel, an event most of the industry had considered mathematically impossible. Cushing storage ran out and longs holding the expiring contract had to pay someone to take physical delivery. The event is explored in Chapter 23 (Negative Prices).
Figure 1-12: OPEC Crude Oil Production, 1960 to 2025 (Million Barrels per Day)
Sources: OPEC Annual Statistical Bulletin, EIA, Energy Institute Statistical Review
The energy transition debate has intensified. Electric vehicle adoption has accelerated, especially in China and Europe. The concept of Energy Return on Investment (EROI) - the ratio of energy extracted to energy invested - has re-emerged as a framework for evaluating the transition. Early Pennsylvania wells in the 1860s returned over 100 units of energy per unit invested. Conventional onshore crude today returns 15 to 25 units. Oil sands return 3 to 5. The declining EROI of oil, combined with the rising EROI of solar and wind (which have crossed above gas for most applications), is one of the structural forces pushing the transition. Chapter 25 (Energy Transition) takes this up.
Yet global oil demand has continued to grow, passing 100 million barrels per day in 2023 and approaching 104 million by 2026. The question is no longer whether oil demand will peak, but when, and how steep the decline will be. The shape of the WTI forward curve, whether in contango or backwardation, reflects the market's real-time view on that question. It is covered in Chapter 18 (Futures and Swaps).
Timeline: Key Events in Oil History
Table 1-3: Major events in oil market history, 1859 to 2026
| Year | Event | Price impact |
|---|---|---|
| 1859 | Drake Well, Titusville, Pennsylvania: first commercial oil well in the US | $20/bbl initial; collapsed to $0.10 within two years on oversupply |
| 1870 | Rockefeller founds Standard Oil, begins consolidating US refining | Stabilized prices through monopoly control of refining and transport |
| 1901 | Spindletop gusher in Texas: birth of the modern oil industry | Texas crude fell to $0.03/bbl on flood of supply |
| 1908 | Discovery of oil in Persia (Iran): first major Middle East find | Shifted global supply center eastward over the next 50 years |
| 1911 | US Supreme Court breaks up Standard Oil into 34 companies | Created ExxonMobil, Chevron, and other majors that exist today |
| 1928 | Red Line Agreement and Achnacarry “As-Is” Agreement among the Seven Sisters | Cartel pricing: stable, low prices for 40 years |
| 1938 | Discovery of oil in Saudi Arabia (Dammam No. 7) | Would eventually make Saudi Arabia the world’s swing producer |
| 1960 | OPEC founded in Baghdad by five members | No immediate price impact; producers began asserting sovereignty |
| 1971 | Tehran Agreement; Nixon closes the gold window, ending Bretton Woods | Dollar depreciation eroded OPEC purchasing power, fueling price demands |
| 1973 | Arab oil embargo against the US and Netherlands (Yom Kippur War) | Crude quadrupled from $3 to $12 within months |
| 1979 | Iranian Revolution cuts 5.5 Mbpd of supply; panic buying | Crude doubled from $15 to $35; second oil shock |
| 1983 | WTI crude oil futures begin trading on NYMEX | First transparent, forward-looking oil price; foundation of modern markets |
| 1986 | Saudi Arabia abandons swing role; oil prices collapse 70% | WTI fell from $30 to under $10; bankrupted the Soviet oil economy |
| 1990 | Iraq invades Kuwait; Gulf War | Prices briefly doubled, then returned to pre-war levels within months |
| 1998 | Asian financial crisis plus OPEC overproduction | WTI hit $10.72, lowest inflation-adjusted price in 50 years |
| 2003 | China supercycle begins; demand growth outpaces spare capacity | WTI rose from $25 to $147 over five years |
| 2008 | WTI peaks at $147 in July; global financial crisis collapses demand | Fell from $147 to $32 in five months |
| 2014 | OPEC decides not to cut production; price war against US shale | WTI fell from $100 to $26 over 18 months |
| 2015 | US crude export ban lifted after 40 years | US exports grew from zero to 4+ Mbpd by 2024 |
| 2016 | OPEC+ formed: OPEC partners with Russia and 9 other non-members | Managed production cuts stabilized prices above $50 |
| 2020 | COVID-19 collapses demand; WTI settles at negative $37.63 on April 20 | First negative oil price in history; Cushing storage full |
| 2022 | Russia invades Ukraine; EU sanctions Russian crude and diesel | Brent spiked to $130; diesel cracks hit record $55/bbl |
| 2026 | Iran blocks the Strait of Hormuz; largest supply disruption since 1979 | Brent surpassed $126; Dubai crude hit $166; IEA released 400M bbl from strategic reserves |
Oil history runs in cycles: scarcity and abundance, boom and bust, innovation and disruption. Knowing the cycles is how you read where markets go next. The chapters that follow give you the tools to do that.
The above was updated in 2026. For the full original 2009 chapter, download the 1st edition 2009 PDF.