Chapter 21
The Shale Revolution
The US shale revolution: horizontal drilling, hydraulic fracturing, Permian Basin growth, and how tight oil reshaped global markets.
The Technology Behind Shale
The US shale revolution is the biggest development in the global oil industry since the discovery of Saudi Arabia's Ghawar field in 1948. It was not a single breakthrough. It was the combination of two mature technologies: horizontal drilling and hydraulic fracturing. Neither was new. Horizontal drilling had been used in limited forms since the 1930s, and fracturing since the late 1940s. What changed was their application together, at scale, in tight rock formations previously considered uneconomic.
In conventional oil production, crude migrates upward through porous rock over millions of years until it is trapped beneath an impermeable caprock. A vertical well simply punctures this reservoir and lets pressure push the oil to the surface. In tight oil formations, crude is locked within the source rock itself, typically an organic-rich shale with permeability measured in nanodarcies rather than millidarcies. The rock holds the oil in place and does not give it up willingly. Horizontal drilling allows the wellbore to turn sideways and run for one to three miles through a thin target formation, maximizing contact with the productive rock. Hydraulic fracturing then pumps water, sand, and a short list of chemical additives at extreme pressure to crack the rock open and prop those fractures with sand grains, creating artificial pathways for oil and gas to flow.
Horizontal Well and Frac Stages (Schematic, Not to Scale)
Inside a Frac Job
A modern horizontal frac job is an industrial set piece. A single Permian or Bakken well may consume 10 to 15 million gallons of water, enough to fill 15 to 22 Olympic swimming pools. That water is mixed with 10 to 20 million pounds of proppant, almost all of it engineered sand, and a small fraction of a percent of friction reducer, scale inhibitor, and biocide. The mixture is pumped downhole by a line of diesel or electric pressure pumps with a combined hydraulic horsepower rating of 50,000 to 80,000, working together to push the slurry through perforations at treating pressures around 9,000 psi. The lateral is stimulated in 40 to 60 discrete stages, each isolated by plugs and each pumping for an hour or two. Crews run around the clock and typically finish a well in one to two weeks.
Table 21-1: Typical frac job parameters, Permian horizontal well
| Frac job parameter | Typical range (Permian horizontal) |
|---|---|
| Lateral length | 8,000 to 15,000 ft |
| True vertical depth | 7,000 to 10,000 ft |
| Frac stages per well | 40 to 60 |
| Water per well | 10 to 15 mil gal |
| Proppant per well | 10 to 20 mil lbs sand |
| Treating pressure | 7,000 to 10,000 psi |
| Pumping horsepower | 50,000 to 80,000 HHP |
| Completion duration | 7 to 14 days |
| Drilling days per well | 8 to 15 days (2024 vintage) |
George Mitchell and the Barnett Shale
The modern shale era began with George Mitchell, a Houston-based independent operator who spent nearly two decades and over $250 million trying to make the Barnett Shale in north Texas commercially viable. Mitchell Energy tried dozens of fracturing recipes through the 1990s before achieving economic production rates using slickwater fracturing around 2002. Devon Energy acquired Mitchell Energy in 2002 for $3.1 billion and combined Mitchell's fracturing techniques with horizontal drilling. The result was transformative: Barnett production surged from negligible volumes to over 6 Bcf per day of natural gas by 2012.
Techniques spread rapidly. Operators moved to the Haynesville Shale in Louisiana, the Marcellus and Utica shales in Appalachia, and the Eagle Ford and Permian Basin in Texas. US dry gas production rose from 21 Tcf in 2006 to over 37 Tcf by 2024. Henry Hub, which had averaged $8.86 per MMBtu in 2008, fell below $3 on an annual average basis as new supply overwhelmed domestic demand. By 2024 Henry Hub averaged just $2.19 per MMBtu, even as the US became the world's largest LNG exporter.
Figure 21-1: Henry Hub Spot Price, Annual Average 2000 to 2025
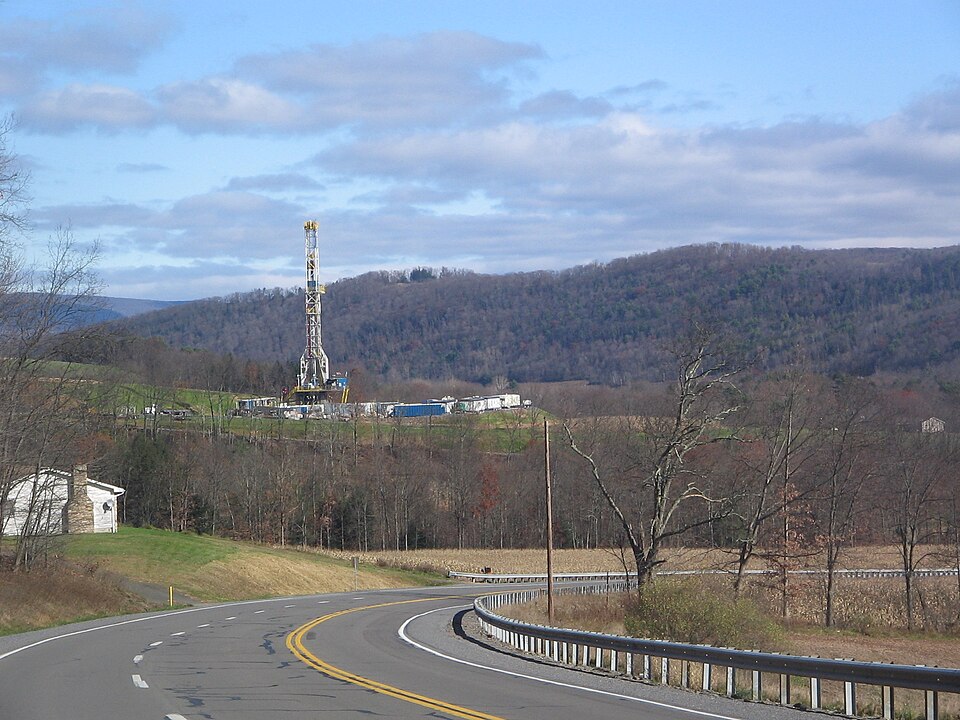
Tight Oil and the Permian Basin
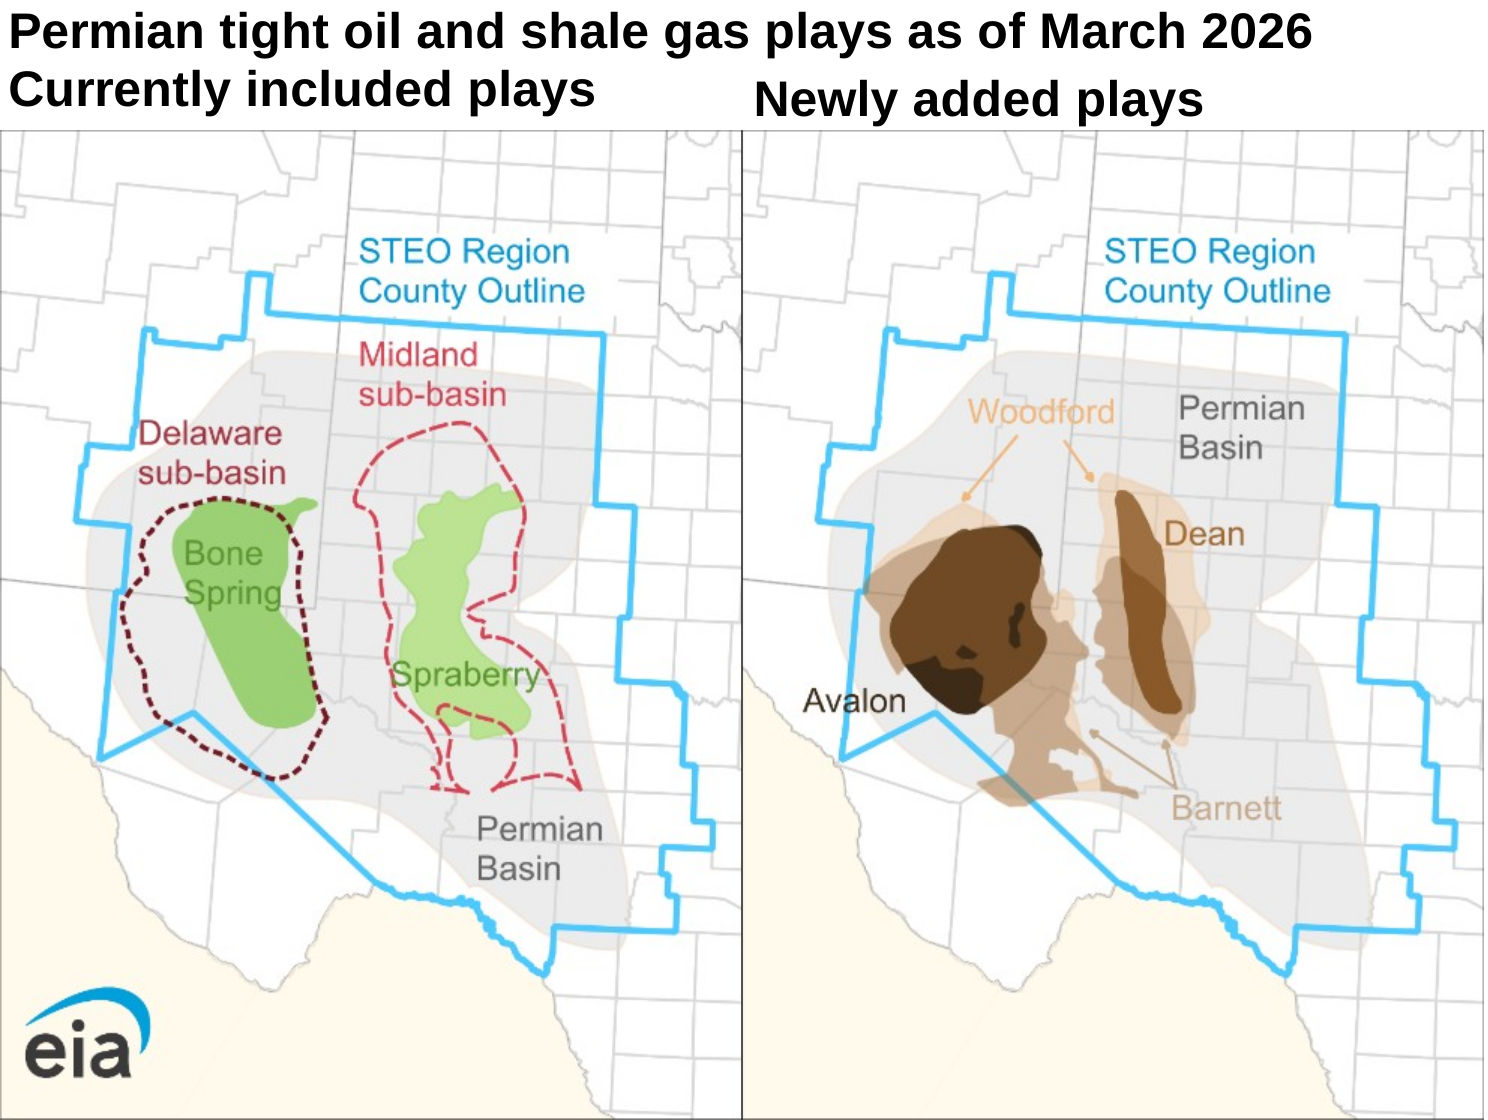
The application of shale techniques to oil came slightly later, beginning around 2010 in the Bakken formation of North Dakota and the Eagle Ford in south Texas. But it was the Permian Basin of west Texas and southeast New Mexico that became the epicenter of the tight oil revolution. The Permian is a geological anomaly: a thick stack of multiple productive formations, including the Wolfcamp, Bone Spring, Spraberry, Avalon, Dean, Barnett, and Woodford, layered on top of each other like a wedding cake. A single surface location can access half a dozen pay zones, which is why operators drill cube developments with multiple laterals stacked vertically off one pad.
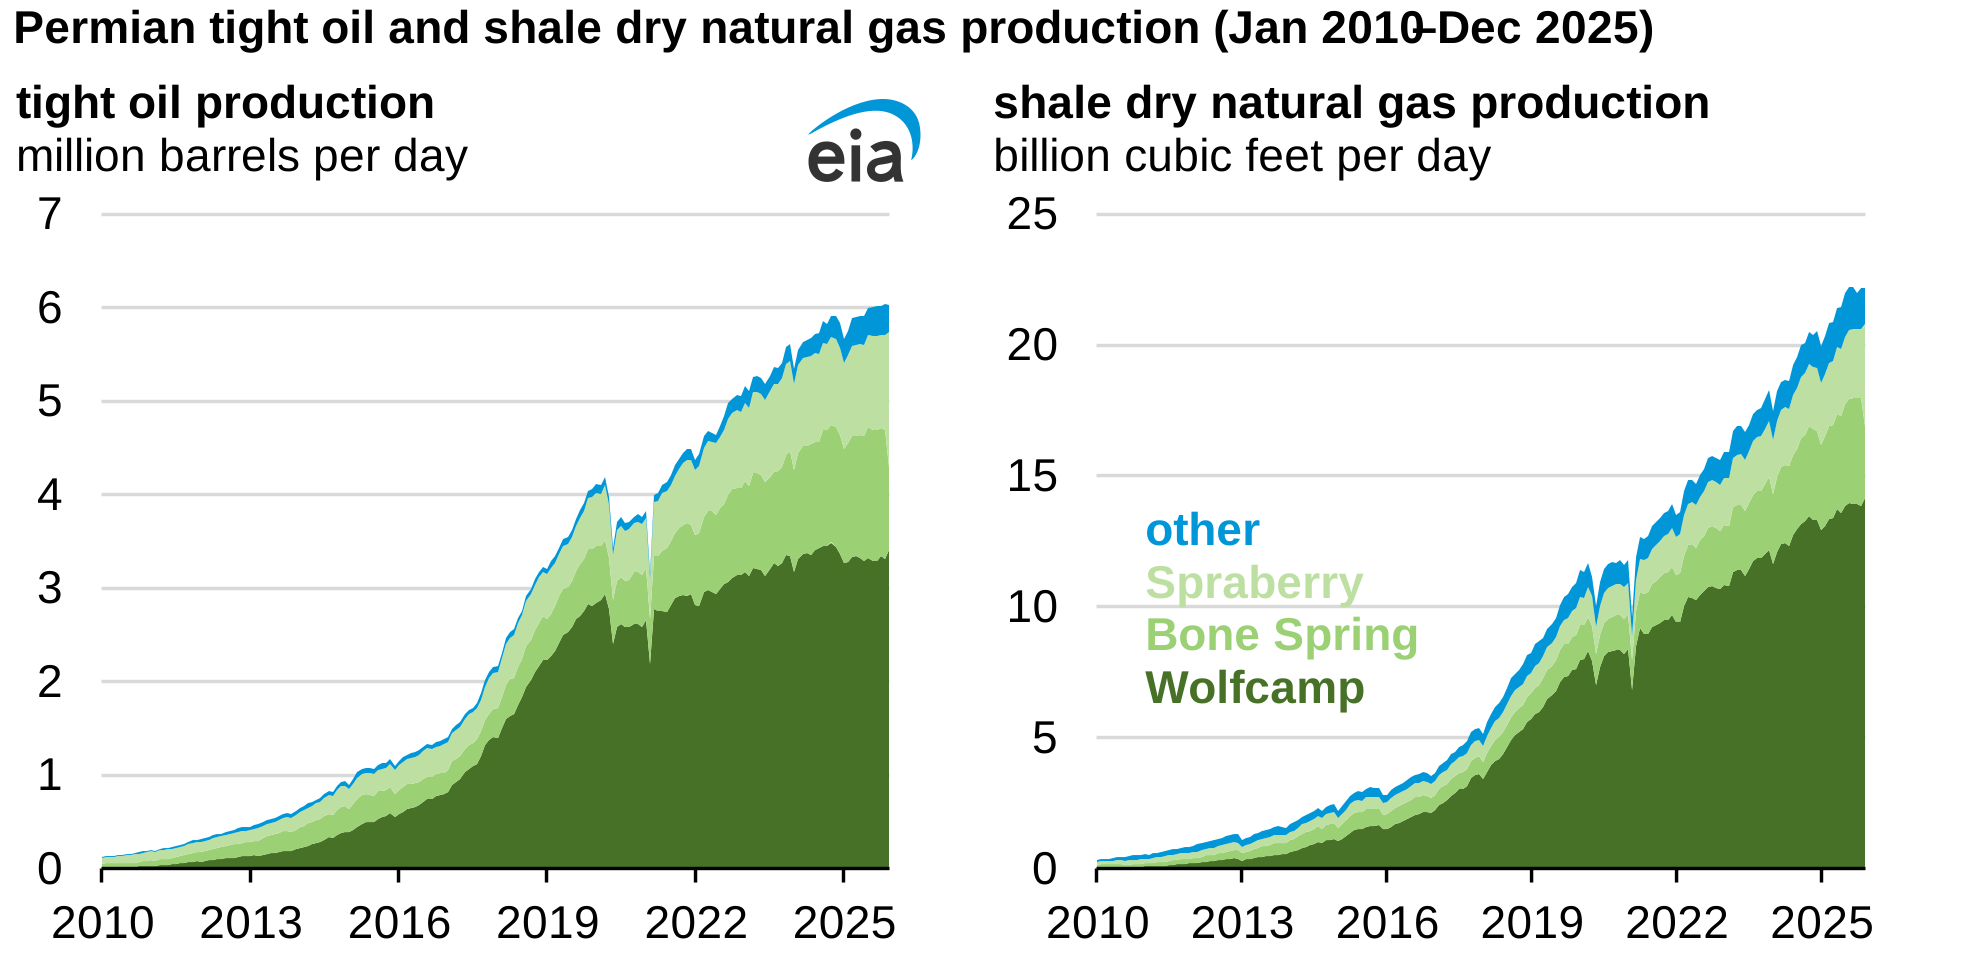
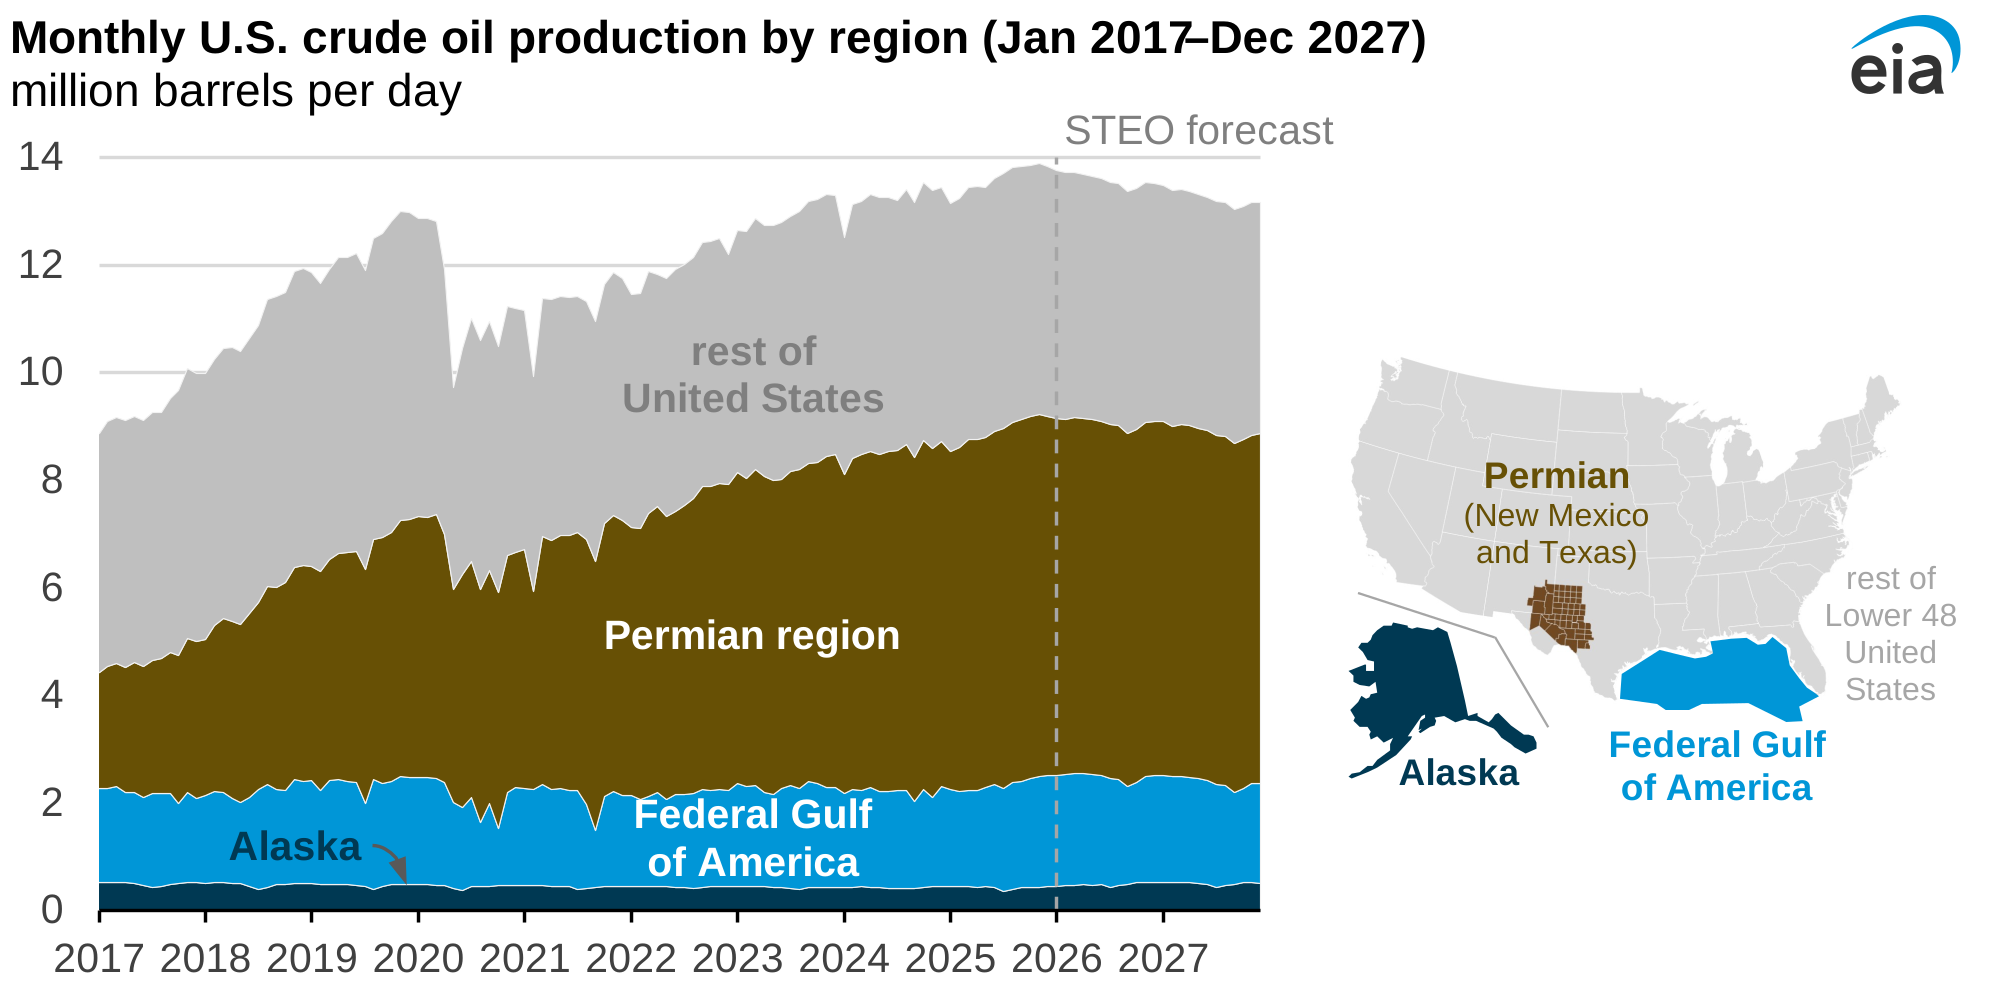
US crude oil production rose from a low of 5.0 million barrels per day in 2008 to 13.2 million barrels per day in 2024 and a record 13.6 million barrels per day in 2025 per the EIA Short-Term Energy Outlook, surpassing both Saudi Arabia and Russia to become the world's largest producer. The Permian alone produces over 6 million barrels per day of crude, accounting for nearly half of total US output, according to the EIA Drilling Productivity Report. Combined with roughly 1.3 million barrels per day from the Bakken and 1.1 million barrels per day from the Eagle Ford, tight oil from three basins supplies more crude than any OPEC country except Saudi Arabia.
US Crude Oil Production, 1860 to 2025
The Basins
Each shale basin has its own geology, its own dominant product, and its own economics. Breakeven prices below are rough analyst estimates for core acreage at the wellhead; real numbers move with service costs, completion design, and differentials to benchmark hubs. Ranges synthesize Dallas Fed Energy Survey responses and Rystad analyst consensus as of Q1 2025.
Table 21-2: Major US shale basins: geology, output and breakevens
| Basin | Formation age | State(s) | Primary product | Recent output | Core breakeven |
|---|---|---|---|---|---|
| Permian | Wolfcamp, Permian age | TX, NM | Oil and associated gas | 6.2 Mbpd | $35 to $45 per bbl |
| Bakken | Late Devonian to Early Mississippian | ND, MT | Light sweet oil | 1.3 Mbpd | $45 to $55 per bbl |
| Eagle Ford | Late Cretaceous | TX | Oil, condensate, gas | 1.1 Mbpd | $45 to $55 per bbl |
| Haynesville | Late Jurassic | LA, TX | Dry gas | 14-16 Bcf/d | $2.75 to $3.50 per MMBtu |
| Marcellus | Middle Devonian | PA, WV, OH | Dry gas and wet gas | 28-30 Bcf/d | $2.00 to $2.75 per MMBtu |
| Utica | Late Ordovician | OH, PA, WV | Dry gas and condensate | 7-8 Bcf/d | $2.25 to $3.00 per MMBtu |
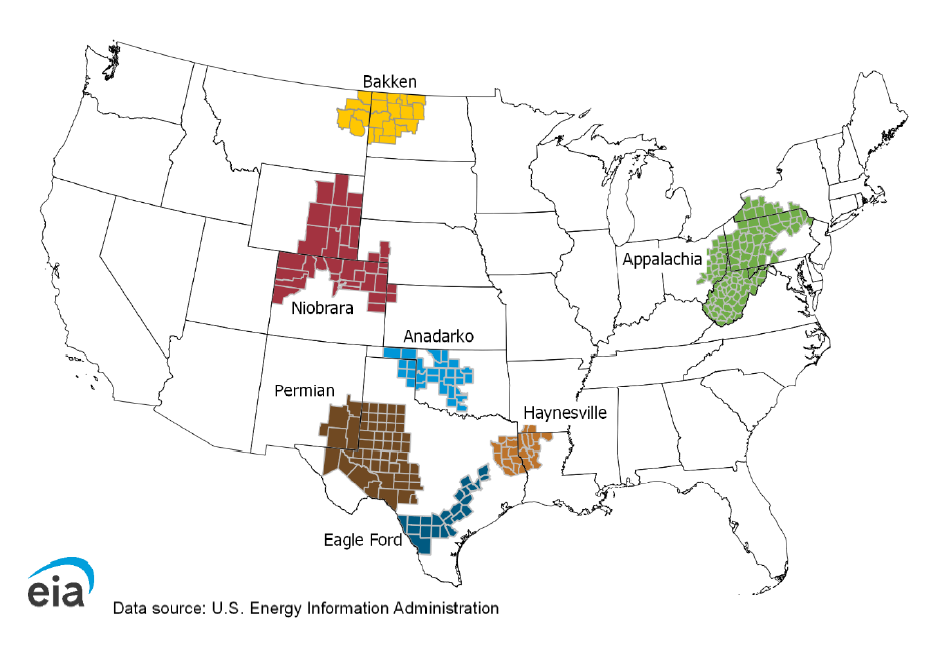
Figure 21-7: Permian, Bakken, and Eagle Ford Crude Production, 2010 to 2025 (Mbpd)
Sources: EIA Drilling Productivity Report, EIA Tight Oil Production Estimates
The 2014 Price Collapse
OPEC initially underestimated shale. When US production began displacing OPEC barrels from the Atlantic Basin market, Saudi Arabia faced a choice: cut production to support prices, losing market share to shale, or maintain production and let prices fall, hoping to drive shale producers out of business. In November 2014, OPEC chose the latter. WTI crude fell from over $100 per barrel in mid-2014 to below $30 by early 2016.
The price war inflicted real damage. Over 100 US exploration and production companies filed for bankruptcy between 2015 and 2017. But the industry adapted. Drilling efficiency jumped: the time to drill a horizontal Permian well fell from around 30 days in 2013 to under 10 days by the early 2020s, and feet drilled per rig per year roughly tripled from 2014 levels as rigs got more powerful, bit design improved, and crews optimized pad drilling. Breakeven costs in core acreage dropped from $70 to $80 per barrel to $35 to $45. When prices recovered, shale production came roaring back, faster than OPEC anticipated.
The Shale Treadmill
Shale wells have a distinctive production profile. Initial rates are high, often exceeding 1,000 barrels per day in the first month, but output declines steeply, typically by 60 to 70 percent in the first year and another 30 to 40 percent in the second. Producers must continuously drill new wells simply to hold production flat, a phenomenon the industry calls the shale treadmill. A mature conventional field in the Middle East might decline at 2 to 5 percent per year. A shale-dominated US production base would decline at roughly 40 percent per year without new drilling.
Figure 21-9: Shale vs Conventional Decline Curves (Illustrative)
Laterals, Parent-Child Wells, and Drilling Efficiency
The single biggest efficiency gain in the shale era is lateral length. Average US horizontal laterals have grown from roughly 5,000 feet in 2010 to over 10,000 feet (roughly two miles) by 2024. Permian laterals now routinely exceed 12,000 feet. Longer laterals contact more reservoir rock per well without repeating the expensive vertical section, so the cost per barrel of recovery drops with every additional foot of lateral.
Average Horizontal Lateral Length by Basin, 2005 to 2025
Rig efficiency reinforces the effect. The US now produces more oil with fewer rigs than in 2014 because each rig drills longer laterals faster. Days to drill a Permian horizontal well have fallen from over 30 in 2013 to under 10 by 2024. The rig count needed to hold production flat has dropped accordingly. This is the treadmill paradox: companies must keep drilling because of steep decline curves, but each new well is cheaper and more productive than the last.
North American Rig Share by Trajectory, 1991 to 2025
When a producer drills the first well in a section, that is the parent. Subsequent wells drilled nearby in the same formation are children. Child wells often underperform parents because the parent's fractures have already drained nearby rock. Spacing optimization, how close to drill children, is one of the most contested technical questions in the Permian. Too close and new fractures communicate with old ones (frac hits), damaging both wells. Too far and reserves are stranded between the wellbores.
Modern shale is a manufacturing process, not exploration. Rigs move along a planned schedule across pre-permitted pad locations. Completions crews (frac fleets) follow the rigs on a separate schedule. A typical Permian operator runs two to three rigs and one to two frac crews continuously. The separation of drilling and completions into independent workflows is what makes shale scale like a factory.
A typical frac crew is 30 to 50 people operating 20 or more pump trucks, a hydration unit, a blender, and a wireline unit. Crew availability and cost are real constraints on activity levels, especially after the 2020 COVID layoffs thinned the experienced labor pool. In tight oil production, crews pump large amounts of water along with proppant and a small fraction of chemical additives into a well at high pressure to fracture the rock where the oil is contained. The process has been compared to manufacturing, with constant fracking machinery and crews moving along over a formation.
Lateral Wells from Surface Pads (Illustrative)
Figure 21-13: Permian Drilling Efficiency, 2010 to 2025
Sources: EIA Drilling Productivity Report, Enverus, operator investor presentations
Tight Oil Breakevens and the Global Marginal Cost of Supply
Since 2009, tight oil production from Texas and North Dakota has reversed a long-term decline in US oil production. US crude output bottomed at roughly 5 million barrels per day in 2008 and reached 13.6 million barrels per day by 2025. This added roughly 8.6 million barrels per day of supply to the global market, and tight oil resources added an estimated 10 to 15 percent to global technically recoverable oil resources.
The cost of producing tight oil has become the global marginal cost of supply: the price of the highest-cost barrel the world needs to meet demand. Full-cycle breakevens (including land acquisition, drilling, completion, infrastructure, and overhead) vary by basin:
Table 21-3: Shale breakevens: full-cycle against half-cycle
| Basin | Full-cycle breakeven | Half-cycle breakeven |
|---|---|---|
| Permian (Midland) | $61 per bbl | $35 to $45 per bbl |
| Permian (Delaware) | $62 per bbl | $35 to $45 per bbl |
| Bakken | $65 per bbl | $45 to $55 per bbl |
| Eagle Ford | $62 per bbl | $45 to $55 per bbl |
| Haynesville (gas) | $2.50 to $3.50 per MMBtu | $1.50 to $2.50 per MMBtu |
Full-cycle costs include everything needed to bring a new well to production from scratch: land, permitting, drilling, completions, facilities, and corporate overhead. The Dallas Fed Energy Survey, the primary source for breakeven tracking, reports a US average of $65 per barrel for new wells. Half-cycle costs cover only drilling and completing a well on an existing lease, and run $10 to $15 per barrel lower.
Before the shale revolution, the marginal barrel came from conventional mega-projects (deepwater, oil sands, Arctic) with five- to ten-year lead times. Prices could overshoot for years because supply could not respond. Tight oil is short-cycle: six to twelve months from investment decision to first oil. This compressed the price cycle. When prices fall below tight oil breakevens, US drilling slows, supply falls, and prices recover. When prices rise, rigs return within quarters. This self-correcting mechanism is why oil prices have been roughly range-bound between $50 and $90 since 2016.
US Tight Oil by Basin (2024)
US Shale Nat Gas Basins (2024)
Tight Oil by Basin (Mbpd)
Shale Nat Gas by Basin (Bcf/d)
Lifting the Crude Export Ban
For forty years, US law forbade the export of domestic crude oil. The ban was written in 1975 in response to the 1973 Arab oil embargo and stayed on the books long after the strategic logic had inverted. By 2014 the shale boom had trapped a glut of light sweet crude on the Gulf Coast, where many refineries were configured to run heavier imported grades. Domestic light crude traded at steep discounts to world prices, and producers lobbied hard for relief. In December 2015, Congress lifted the ban as part of an omnibus spending bill. US crude exports were effectively zero before the ban was lifted. By 2024 they had reached roughly 4.1 million barrels per day, flowing to refiners in Europe, Asia, and Latin America, and making the United States one of the largest seaborne crude suppliers in the world.
Figure 21-15: US Crude Oil Exports, 2014 to 2025 (Million Barrels per Day)
Sources: EIA Petroleum Supply Monthly, US Census Bureau
Consolidation and the Chevron-Hess Deal
By the mid-2020s, shale had matured. Explosive growth gave way to capital discipline, as public companies prioritized free cash flow and shareholder returns over production growth. Mergers and acquisitions accelerated: ExxonMobil acquired Pioneer Natural Resources in 2024 for roughly $60 billion, Diamondback absorbed Endeavor Energy Resources, Occidental bought CrownRock, and ConocoPhillips acquired Marathon Oil. The consolidation wave signaled that the best acreage was finite, and the industry was entering a later phase of development.
The capstone deal was Chevron's $53 billion all-stock acquisition of Hess Corporation, valued at roughly $60 billion including assumed debt and announced in late 2023. The deal was held up for more than a year by an arbitration dispute with ExxonMobil and CNOOC, Hess's partners in the Stabroek block offshore Guyana, one of the largest deepwater oil discoveries of the century. Exxon and CNOOC argued that they held a right of first refusal over the Hess stake; Chevron and Hess argued the right did not apply to a corporate change of control. The arbitration panel heard the case in May 2025 and ruled in Chevron's favor, and Chevron reported the transaction closed on July 18, 2025. With the close, Chevron inherited Hess's 30 percent working interest in the Stabroek block alongside its North Dakota Bakken position. Guyana is a conventional deepwater asset rather than a shale play, but the deal underscored how quickly the US independents that built the shale revolution were being absorbed by the majors.
Today, producers actively hedge their future production with swaps, collars, and three-way structures to lock in prices and protect cash flows against the inherent volatility of commodity markets. The hedge book is now a standard disclosure for every publicly traded US independent, and it is one reason the shale base is more resilient to price shocks than it was during the 2014 to 2016 collapse.
Shale turned conventional wisdom on its head. The US was supposed to be a depleting oil province. Instead, it became the world's swing producer, able to ramp output up or down within months rather than years. Geopolitical consequences are still unfolding, and Chapter 22 (OPEC+), Chapter 23 (Negative Prices), and Chapter 24 (US LNG) trace them through the birth of OPEC+, the April 2020 negative price day, and the rise of US LNG.