Chapter 22
OPEC+
OPEC+ explained: the Saudi-Russia alliance, production cuts, price wars, spare capacity management, and quota politics since 2016.
From OPEC to OPEC+
For over fifty years, OPEC operated as the sole cartel managing global oil supply. Founded in Baghdad in September 1960 by Saudi Arabia, Iran, Iraq, Kuwait, and Venezuela, it grew through the 1960s and 1970s into a thirteen-member organization controlling roughly 35 to 40 percent of world crude production. By the mid-2010s, that share was no longer enough. The 2014 to 2016 price war against US shale had failed to break its competitor. Non-OPEC supply, led by Russia, was at record levels. Brent and WTI languished below 50 dollars per barrel, and member states burned through foreign exchange reserves to fund budgets built on 80-dollar oil.
The answer came on December 10, 2016, at the 171st OPEC Ministerial Meeting in Vienna. OPEC's fourteen members at the time signed a formal accord with eleven non-OPEC producers called the Declaration of Cooperation, or DoC. Under the DoC, participating countries agreed to reduce crude output by roughly 1.8 million barrels per day effective January 1, 2017. The twenty-five nation group controlled around 55 percent of global production, and the informal label "OPEC+" entered the market lexicon immediately. The DoC was not a treaty and had no enforcement mechanism beyond reputational pressure and the monthly oversight of a new Joint Ministerial Monitoring Committee, but it rewired supply management for the rest of the decade.
Russia's participation was the pivot. Moscow had attended OPEC meetings as an observer since the 1980s but had never agreed to coordinate production. Fiscal arithmetic drove the partnership: roughly one third of Russian federal budget revenues came from oil and gas taxation, and sustained sub-50-dollar prices threatened macroeconomic stability. Saudi Crown Prince Mohammed bin Salman and Russian President Vladimir Putin became the political backbone of OPEC+, with Saudi Energy Minister Prince Abdulaziz bin Salman and Russian Deputy Prime Minister Alexander Novak as operational counterparts.
Who Is in the Room
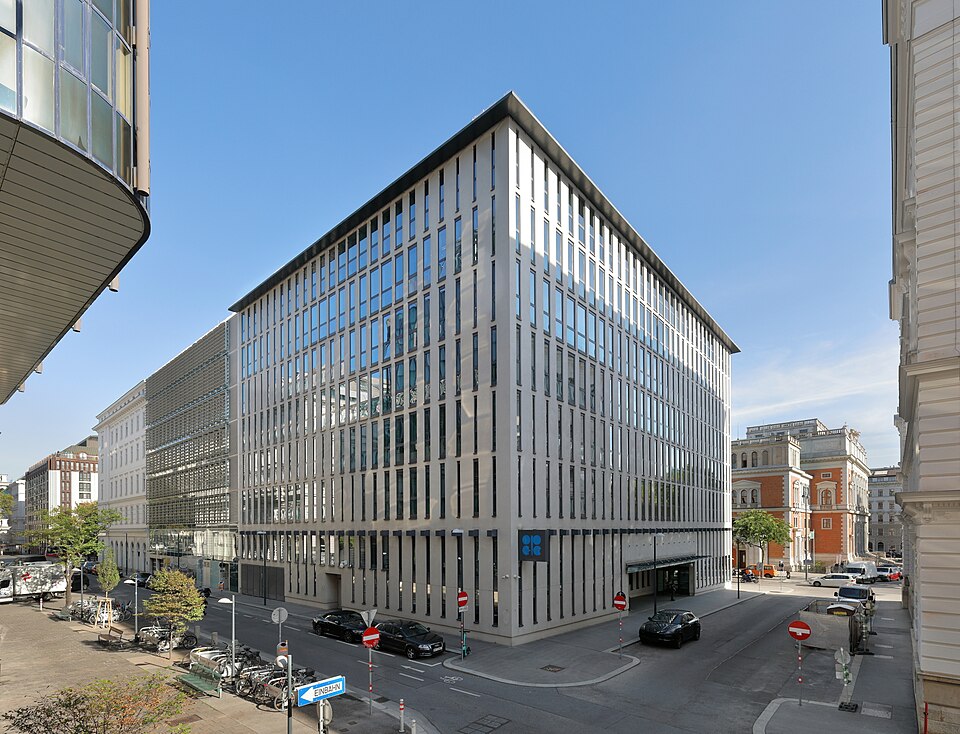
Angola announced its exit from OPEC on December 21, 2023, and left effective January 1, 2024, bringing OPEC back to twelve members. Ecuador, Qatar, and Indonesia had previously departed in 2020, 2019, and 2016 respectively. The United Arab Emirates then announced its own withdrawal from both OPEC and OPEC+ on April 28, 2026, effective May 1, leaving eleven members. It is the largest producer to leave in the organization’s history, about 12 percent of OPEC crude output, and its stated reason was capacity: Abu Dhabi has spent heavily toward a five million barrel per day target and wanted the freedom to reach it. The UAE has since described the decision as economic rather than political and says it remains committed to price stability, but it now sits outside the quota framework entirely. The eleven remaining OPEC members, their year of joining, and their capitals are set out below, with the UAE listed separately because it was a member for most of the period these output figures cover. Production levels are approximate averages drawn from OPEC's Monthly Oil Market Report secondary sources and EIA estimates; monthly figures move around these annual averages.
Table 22-1: OPEC members, year of joining and 2025 crude output
| Country | Joined | Capital | 2025 crude output (Mbpd) |
|---|---|---|---|
| Saudi Arabia | 1960 (founder) | Riyadh | 9.0 |
| Iraq | 1960 (founder) | Baghdad | 4.2 |
| Iran | 1960 (founder) | Tehran | 3.3 |
| Kuwait | 1960 (founder) | Kuwait City | 2.5 |
| Venezuela | 1960 (founder) | Caracas | 0.9 |
| Nigeria | 1971 | Abuja | 1.4 |
| Algeria | 1969 | Algiers | 0.9 |
| Libya | 1962 | Tripoli | 1.2 |
| Gabon | 1975 / 2016 | Libreville | 0.2 |
| Equatorial Guinea | 2017 | Malabo | 0.05 |
| Republic of Congo | 2018 | Brazzaville | 0.25 |
| UAE (member 1967 to 2026) | 1967 | Abu Dhabi | 3.3 |
The non-OPEC half of OPEC+ originally numbered ten or eleven producers under the December 2016 DoC. The practical list has shifted since then, but the active roster of non-OPEC cooperating countries is shown below. Russia and Kazakhstan are by far the largest, and together they represent the bulk of non-OPEC production under the agreement.
Table 22-2: Non-OPEC OPEC+ partners and quota status
| Country | 2025 crude output (Mbpd) | Quota status |
|---|---|---|
| Russia | 9.0 | Full quota, uneven compliance |
| Kazakhstan | 1.8 | Full quota, chronic overproduction |
| Azerbaijan | 0.5 | Quota participant |
| Oman | 0.75 | Quota participant |
| Bahrain | 0.15 | Quota participant |
| Brunei | 0.08 | Quota participant |
| Malaysia | 0.35 | Quota participant |
| Sudan | 0.05 | Quota participant |
| South Sudan | 0.15 | Quota participant |
| Mexico | 1.6 | Left active cooperation after 2020 agreement |
Spare Capacity as the Swing Variable
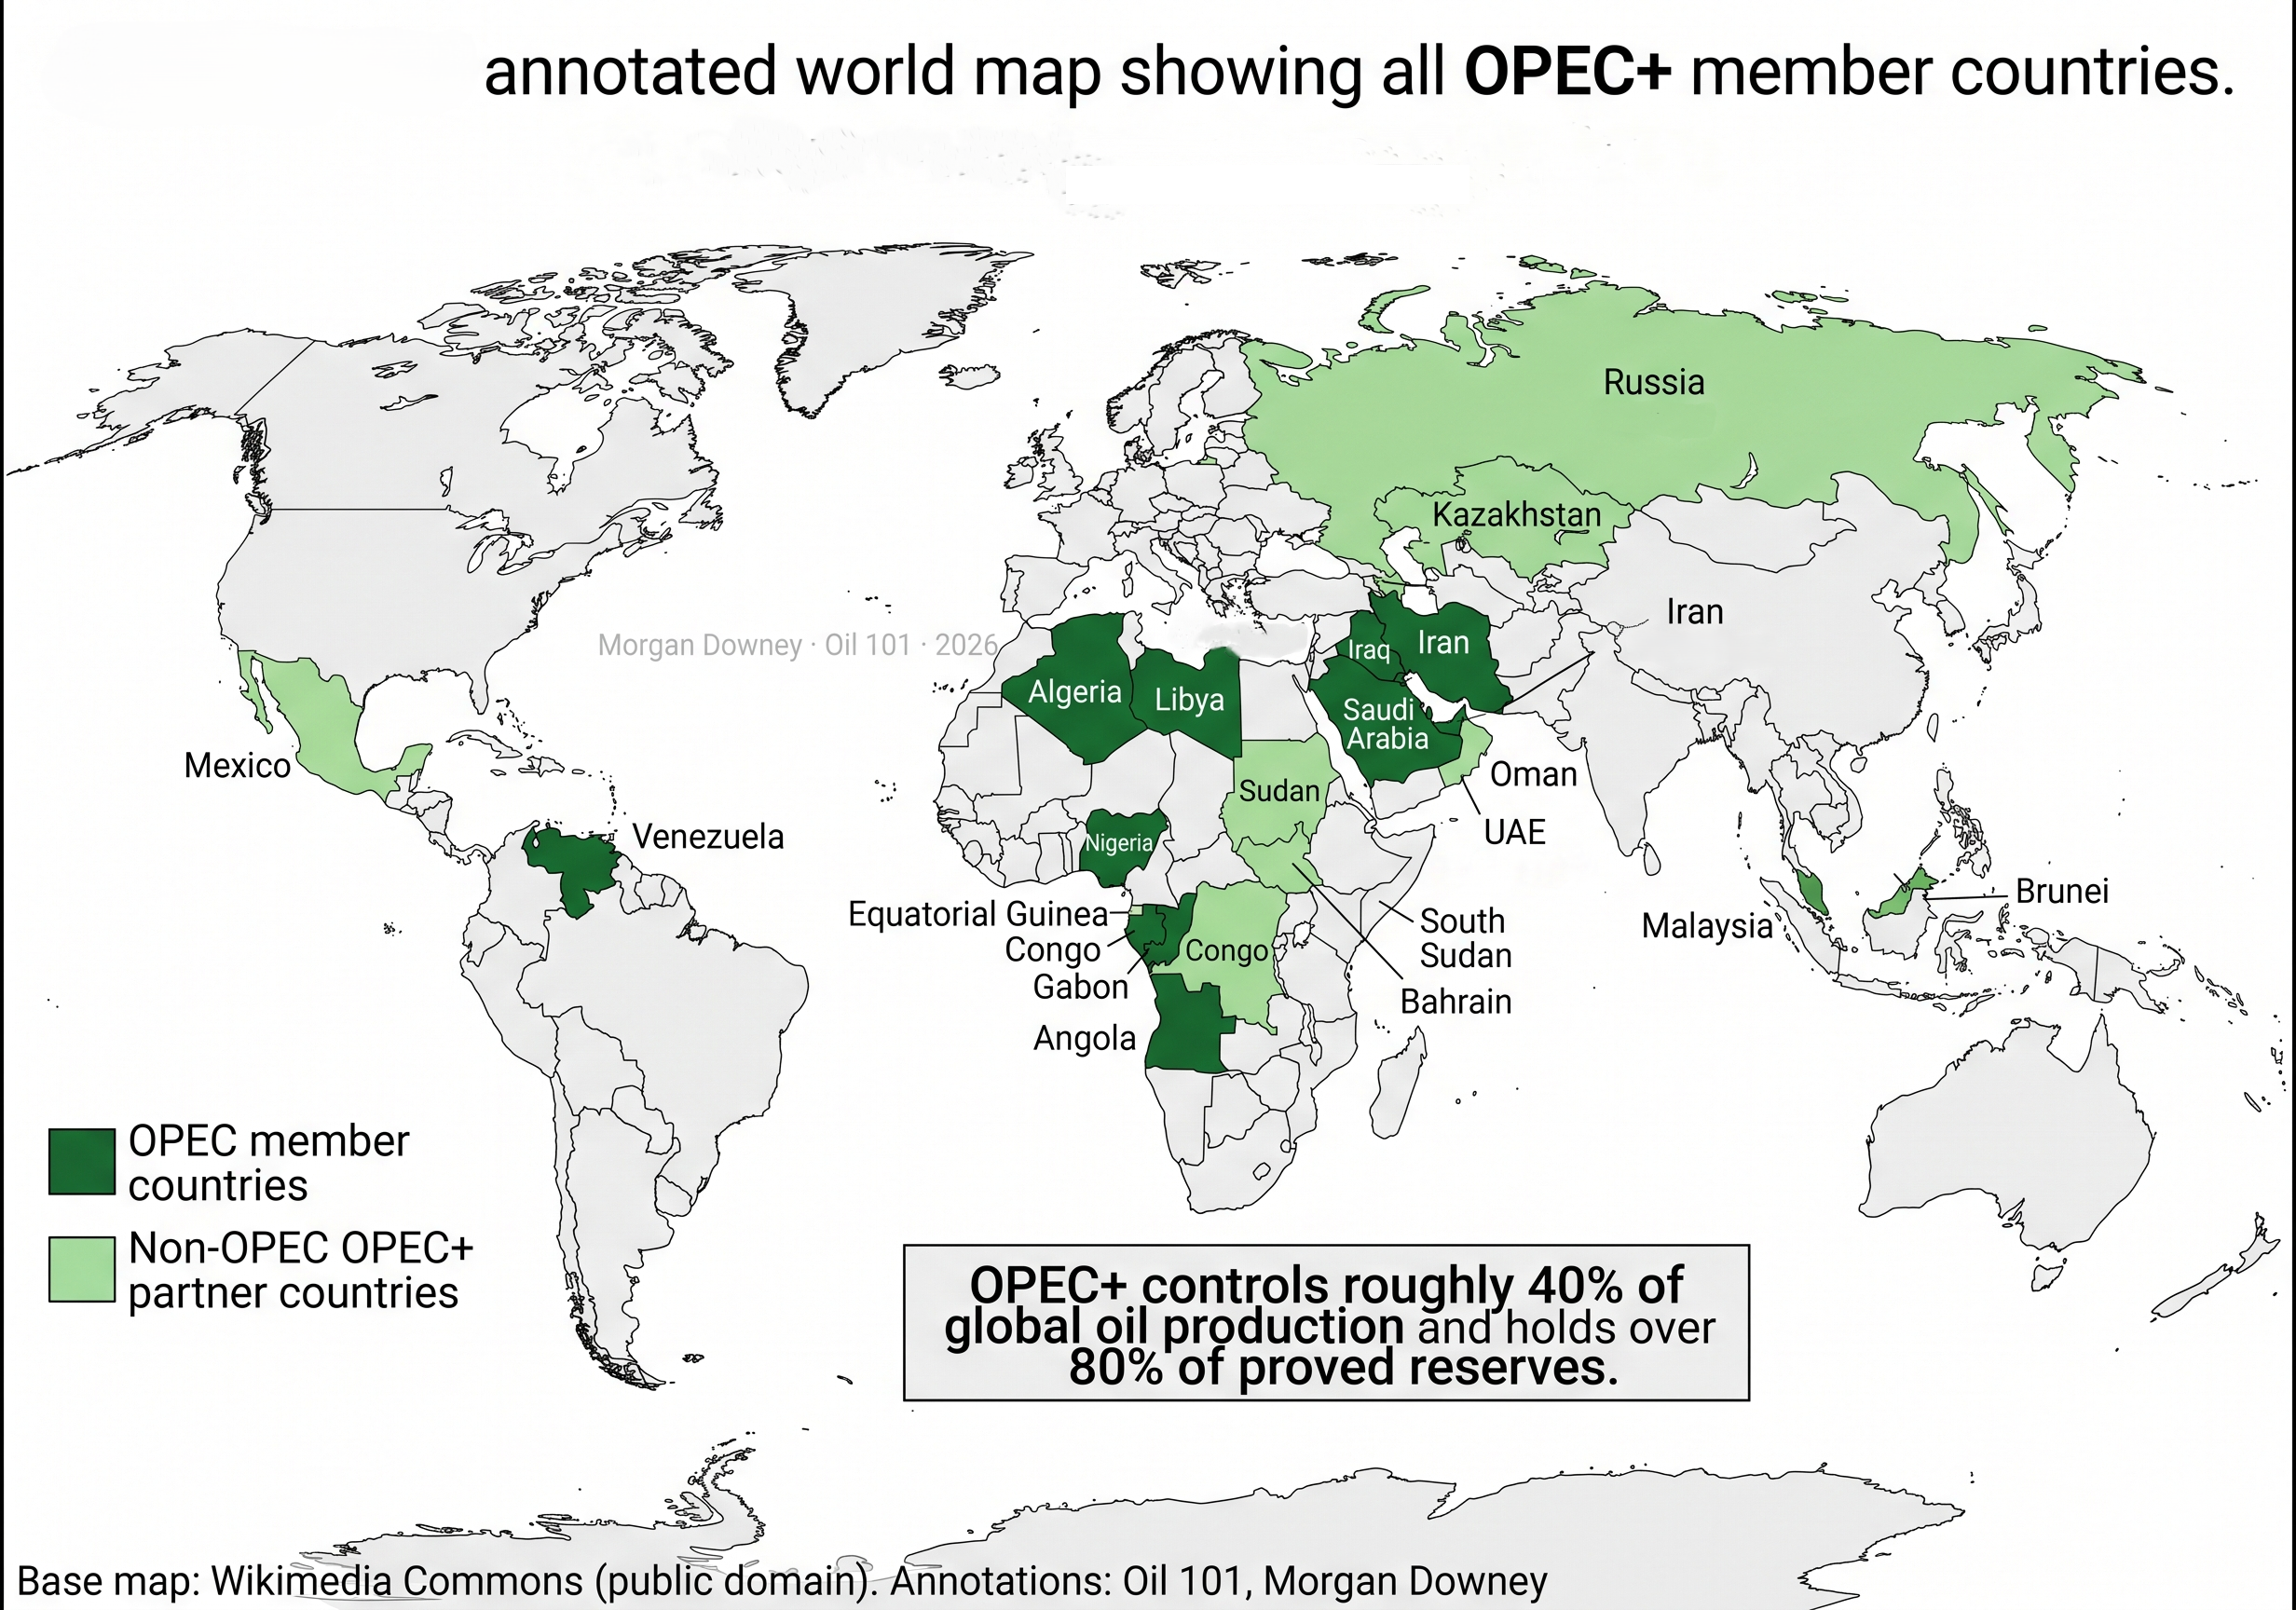
Everything OPEC+ does ultimately runs through one number: effective spare capacity. This is the volume of crude a producer can bring online within 30 days and sustain for at least 90 days without touching strategic reserves. It is the buffer the world has against geopolitical shocks. Historically it is concentrated in Saudi Arabia, which typically holds between 1.5 and 3 million barrels per day of usable spare capacity against a sustainable ceiling near 12 million barrels per day. Kuwait and Iraq hold smaller shares; most other members run essentially flat out. The UAE held the next largest buffer after Saudi Arabia until it left in May 2026, and that capacity did not disappear when it went. It moved outside the number, which is a reminder that “OPEC spare capacity” is a measure of one organization’s reserves rather than of the world’s.
Figure 22-3: OPEC Effective Spare Crude Capacity, 2000 to 2025
Three episodes define the modern spare-capacity story. In the 2005 to 2008 super-cycle, OPEC spare capacity collapsed below 1 million barrels per day as Chinese demand surged and no one invested. There was no real buffer left, and WTI ran to roughly 147 dollars in July 2008. In March and April 2020, the COVID demand collapse did the opposite: it destroyed around 20 million barrels per day of consumption almost overnight, forced OPEC+ into the largest cut in history, and pushed effective spare capacity above 5 million barrels per day. Since mid-2023, Saudi Arabia has stacked voluntary unilateral cuts on top of the group quota, holding production at roughly 9 million barrels per day against capacity closer to 12 million. That keeps headline spare capacity at 4 to 5 million barrels per day on paper, but much of it is being used as a price-management tool rather than a disruption buffer.
Quotas, Baselines, and Compliance
OPEC+ quotas are defined as reductions from a baseline. The baseline matters more than the cut itself, because a high baseline gives a country room to sell more barrels even under a nominally tight agreement. Baselines are renegotiated periodically and are a constant source of friction. The UAE, which had spent heavily to raise capacity toward 5 million barrels per day, pushed hard for a higher baseline and won an increase to 3.519 million barrels per day in the June 2023 agreement. It was not enough: three years later the UAE left OPEC and OPEC+ altogether rather than keep negotiating for room, which is the clearest evidence available that the baseline mechanism binds hardest on the members adding capacity fastest. Iraq and Kazakhstan are the two persistent overproducers; both countries rely on foreign operators under production-sharing contracts and have limited ability to shut in producing wells without contractual disputes.
Monitoring is done by the Joint Ministerial Monitoring Committee, which meets monthly and reviews data from the OPEC Secretariat, the IEA, and the EIA. The three bodies often publish meaningfully different numbers, particularly on demand, which gives members room to argue for either tighter or looser policy depending on their own budget needs. When a country is found to have overproduced, OPEC+ assigns compensation cuts in subsequent months. Compliance has always been imperfect, but under the post-2020 framework it has improved enough to make the headline agreements credible to the market.
Key Moments of OPEC+
Table 22-3: OPEC+ milestones since the Declaration of Cooperation
| Date | Event |
|---|---|
| Dec 10, 2016 | Declaration of Cooperation signed in Vienna; 1.8 Mbpd cut |
| Mar 6, 2020 | Russia rejects deeper cuts; Saudi-Russia partnership breaks |
| Mar 8, 2020 | Saudi Arabia slashes official selling prices, launches price war |
| Apr 12, 2020 | OPEC+ agrees to 9.7 Mbpd cut, largest in history, effective May 1 |
| Apr 20, 2020 | May WTI settles at minus 37.63 dollars per barrel |
| Jul 2021 | Gradual unwind begins at 400 kbpd per month |
| Oct 5, 2022 | OPEC+ announces nominal 2 Mbpd cut |
| Apr 2023 | Voluntary cuts begin, stacked on top of group quota |
| Jun 2023 | UAE baseline raised to 3.519 Mbpd for 2024 |
| Jul 2023 | Saudi Arabia adds unilateral 1 Mbpd voluntary cut |
| Dec 21, 2023 | Angola announces exit from OPEC, effective January 1, 2024 |
| 2025 | Gradual unwind of voluntary cuts begins; pace repeatedly adjusted |
The 2020 Price War
OPEC+'s wildest episode ran five weeks. On March 6, 2020, as COVID-19 spread globally and oil demand collapsed, Russia refused Saudi Arabia's proposal for an additional 1.5 million barrels per day of cuts. Two days later, on March 8, Saudi Arabia retaliated by slashing its official selling prices by the largest amount in twenty years and announcing plans to raise output toward 12.3 million barrels per day. Russia matched the move. Layered on top of a pandemic that would destroy roughly 20 million barrels per day of demand at its worst point, the price war sent WTI from the mid-40s in late February to minus 37.63 dollars on April 20, 2020, when the expiring May contract had no physical buyer willing to take delivery.
Under intense pressure from the Trump administration, which watched its own shale sector head toward mass bankruptcy, OPEC+ reconvened and on April 12, 2020 agreed to the largest production cut in history: 9.7 million barrels per day, effective May 1. The deal nominally ran through April 2022 with step-downs, and was buttressed informally by market-driven declines in the US, Canada, and Brazil that OPEC counted toward the overall reduction. The unwind was deliberately slow. Starting in mid-2021, OPEC+ added back roughly 400,000 barrels per day per month, a pace that lagged the demand recovery and helped push Brent back toward 120 dollars when Russia invaded Ukraine in February 2022.
Saudi Arabia, Aramco, and Ghawar
OPEC+ is ultimately a Saudi-led institution, and the Saudi contribution flows from one field more than any other. Ghawar, in the Eastern Province, is the largest conventional oil field ever discovered. For decades its maximum sustained output was widely assumed to be above 5 million barrels per day. The Saudi Aramco bond prospectus published in April 2019 put the actual maximum at 3.8 million barrels per day, lower than market consensus and a reminder that even the world's greatest field is not infinite. Aramco confirmed 48.25 billion barrels of liquid reserves as of December 2018 in the same document.
Saudi Aramco listed 1.5 percent of its shares on the Tadawul exchange in December 2019 at a valuation of roughly 1.7 trillion dollars, making it briefly the largest IPO in history and the most valuable listed company in the world. The listing formalized what had long been true in practice: Aramco's production and investment decisions are set by the Saudi state, and OPEC+ policy is downstream of Saudi fiscal policy. Vision 2030, the Kingdom's diversification program, requires high oil revenues to fund Neom, the Red Sea project, and the rest of the giga-projects. IMF Article IV estimates of Saudi Arabia's fiscal breakeven climbed from the mid-70s in the late 2010s to roughly 90 dollars per barrel for 2024 and 2025, excluding transfers from the Public Investment Fund. That number explains more about OPEC+ production policy than any public statement.
Russia After the Invasion
Russia's role in OPEC+ was complicated, then redefined, by the February 2022 invasion of Ukraine. On December 5, 2022, the European Union's ban on seaborne imports of Russian crude took effect, and on the same day the G7 and allies imposed a 60 dollar per barrel price cap on Russian crude carried by G7-linked shipping, insurance, and finance. The cap was designed to keep Russian barrels flowing to the global market, specifically to avoid the supply shock that a full embargo would have produced, while squeezing Russian export revenues. A similar cap on Russian refined products followed on February 5, 2023.
Russian exports were redirected, not reduced. Urals crude traded at wide discounts to Brent through 2023, then narrowed as shipping routes adapted. ESPO blend, loaded at Kozmino on the Pacific, went almost entirely to China. Most western-bound Urals exports were replaced by sales to India, where refiners bought deeply discounted cargoes, processed them, and re-exported refined products into Europe. A shadow fleet of older tankers operating outside G7 insurance built up rapidly, carrying a growing share of Russian barrels at prices above the cap. Through all of this, Russia remained an active OPEC+ member. Compliance on the agreed cuts was uneven, but the political commitment to the Saudi partnership held.
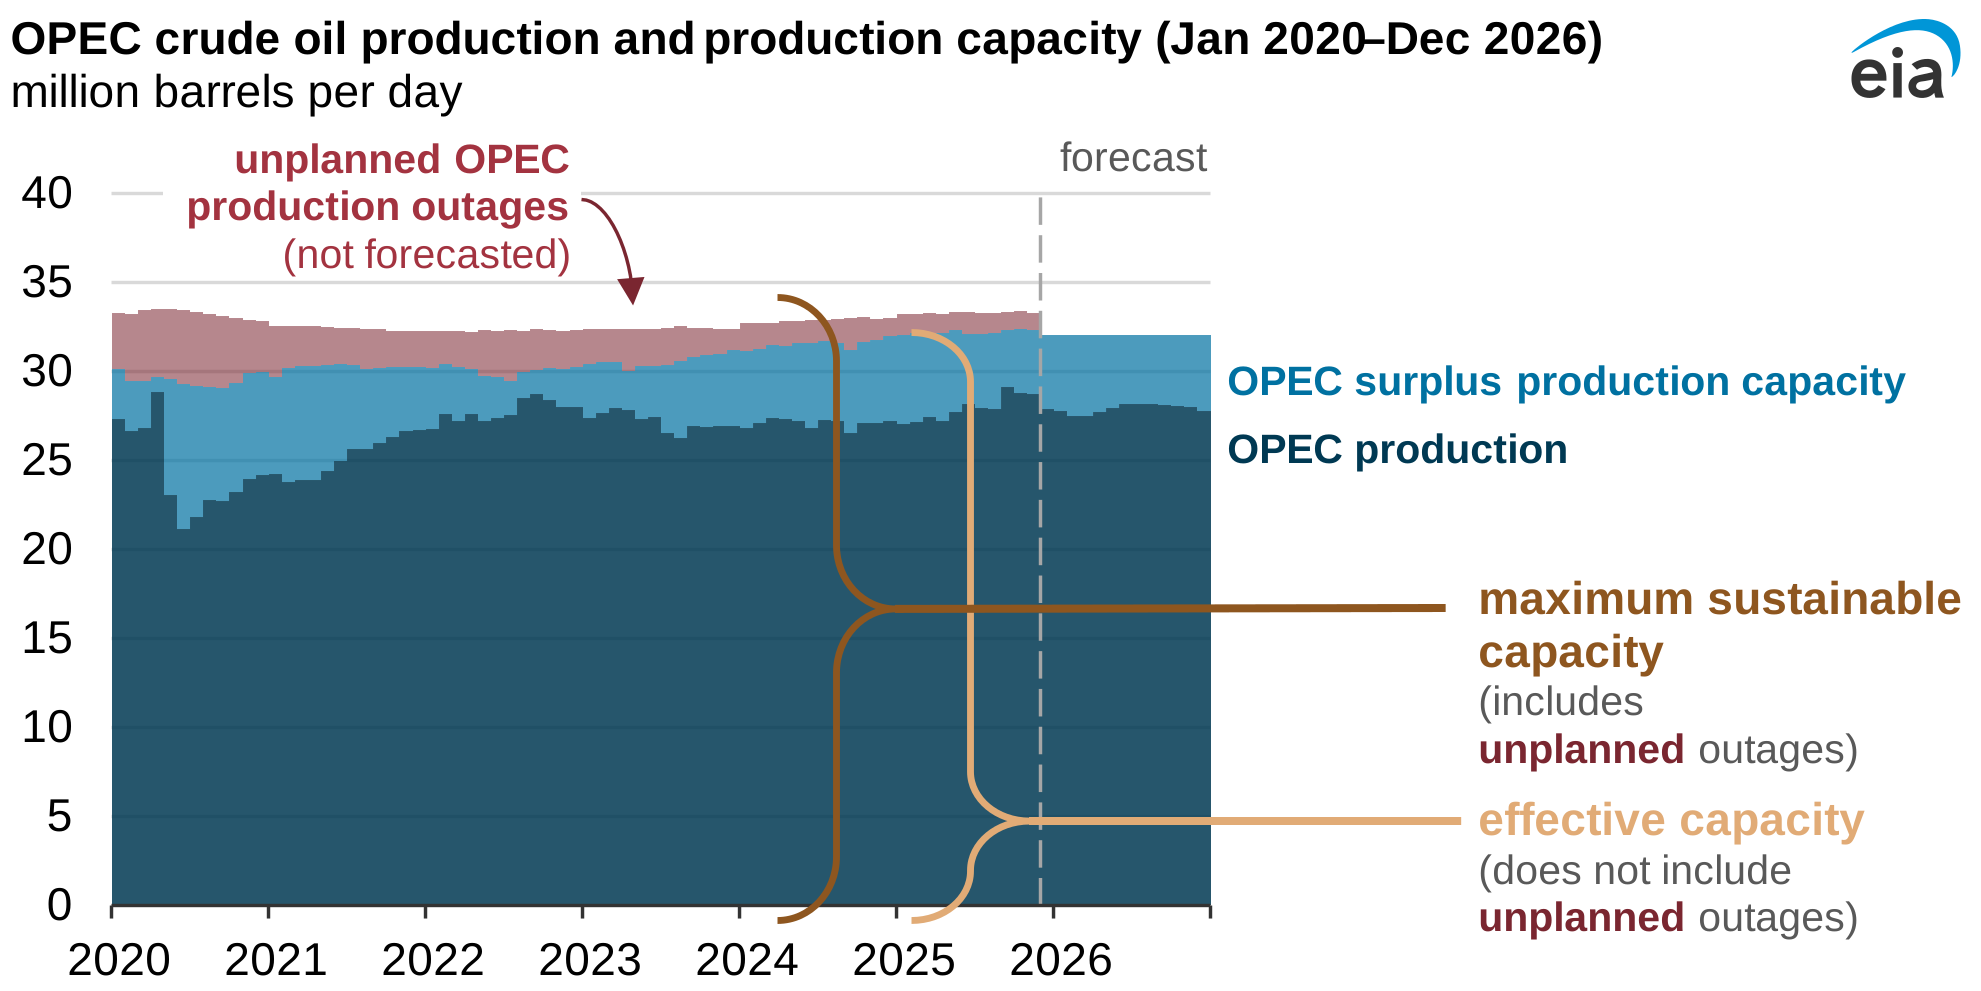
Figure 22-5: OPEC Share of Global Crude Production, 1970 to 2025
Sources: OPEC Annual Statistical Bulletin, Energy Institute Statistical Review. Illustrative annual averages.
The Strategic Calculus
OPEC+'s problem in the mid-2020s is the old problem in a new coat: price support versus market share. Every dollar of price support incentivizes more US shale drilling, more deepwater investment in Guyana and Brazil, more Canadian oil sands expansion, and faster EV adoption. Cutting too aggressively risks structural loss of demand. Cutting too little risks fiscal crises in member states built on 80-dollar-plus oil. Saudi Arabia in particular is caught between the Vision 2030 breakeven and the knowledge that the last time it tried to defend market share against shale, in 2014 to 2016, it burned through hundreds of billions of dollars of foreign reserves and eventually reversed course.
The hedging behavior of US producers sharpens the dilemma. When US shale operators lock in forward prices through swaps, collars, and three-way structures, they insulate their cash flows from OPEC-driven declines. A 2015-style price war would work more slowly against a hedged, debt-light, consolidated shale industry than it did against the over-levered pre-2015 version. That reality pushes OPEC+ toward price management rather than market-share warfare, and it explains why the alliance has chosen repeated voluntary cuts over a repeat of the 2014 shale battle.
"OPEC+ is not just about oil. It is the most consequential geopolitical partnership between the Middle East and Russia since the Cold War."
OPEC+ is a broader supply-management framework than OPEC alone. Its durability depends on whether the Saudi-Russian partnership can withstand divergent national interests, demand uncertainty, and the relentless growth of non-OPEC supply from shale, Guyana, and Brazil.