Chapter 20
Managing Oil Price Risk
Oil hedging strategies for producers and consumers: swaps, collars, three-ways, put spreads, and corporate treasury workflows.
Why Commodities Are Volatile
Commodities are the most volatile asset class compared to equities, currencies, and bonds. Oil has historically averaged roughly 35-40% annualized volatility, compared to about 19% for the S&P 500, 10% for EUR/USD, and 7% for US Treasuries. The reason: commodities are expensive to store, so large ready-to-consume inventories rarely exist. Supply shortages take months or years to fix, while equity and currency shortages can be resolved quickly by issuing more shares or printing money.
The Case for Hedging
Hedging uses derivatives (futures, swaps, and options) to reduce the short-term impact of volatile price movements on a business. Over the long term, hedging transactions will roughly break even after bid/offer spreads. The value comes not from making money on hedges, but from the strategic benefits of predictable cash flows.
Reduced cash flow volatility lowers bankruptcy risk, improves borrowing terms, enables accurate budgeting and earnings forecasts, and lets management focus on core competencies rather than oil market speculation. An airline's executives are transportation logistics experts, not oil traders. Hedging lets them concentrate on what they do best.
Not hedging is itself a decision: management is choosing to expose the organization to full oil price volatility. This should be an active, communicated choice, not a passive default.
Corporate Hedging Objectives by Firm Type
Before any discussion of instruments or accounting, the first question for a hedger is: what are we actually trying to achieve? Different firms in the oil value chain have very different answers, and the answer drives the choice of instrument, tenor, and hedge ratio.
Table 20-1: Typical Hedging Objectives by Firm Type
| Firm type | Objective | Typical instrument mix |
|---|---|---|
| E&P producer | Lock in cash flow for debt service and capex; protect RBL borrowing base; stabilize PDP value | Swaps, collars, three-way collars (24 to 36 month tenor) |
| Integrated major | Little or no price hedging; vertical integration is the natural hedge (upstream gains offset downstream losses) | Minimal; occasional project-specific hedges |
| Refiner | Hedge the crack spread, not crude outright; protect input-output margin | 3:2:1 / 2:1:1 crack spread swaps and options |
| Airline | Jet fuel cost stability; explicit hedge ratio (e.g. 50% of next 12 months' budget) | Jet/gasoil swaps, call options, collar structures |
| Power generator | Pass-through where regulation allows; otherwise direct hedging of gas or fuel oil | Natural gas and distillate swaps; tolling agreements |
| Physical trader | Hedge inventory and transit risk; every physical position has a paper offset | Futures, EFPs, time spreads |
| Industrial consumer | Operating cost stability for plastics, petchem, asphalt, lubricants buyers | Fixed-price supply contracts; swaps against benchmarks |
Hedging Instruments
Producers typically sell swaps (locking in a fixed price) or buy puts (establishing a floor). Consumers typically buy swaps or calls. The most common structure for both is the zero-cost collar: a producer buys a put and sells a call, establishing a price range with no upfront premium. Three-way collars add a sold put below the bought put for a wider zero-cost range, at the cost of limited downside protection. Chapter 18 (Futures and Swaps) and Chapter 19 (Options) cover the instrument mechanics in detail; this chapter is about how they are used, combined, and governed inside a corporate treasury.
Common Hedging Strategies
Swap (Fixed Price)
Locks in a specific price. No upfront cost, but no upside or downside flexibility. Used by producers and consumers alike.
Zero-Cost Collar
Buy a put (floor) and sell a call (cap). No upfront premium. Establishes a price range. The most popular hedging structure.
Three-Way Collar
Buy a put, sell a call, and sell a lower put. Widens the zero-cost range but limits downside protection below the sold put.
Put Spread / Call Spread
Buy one strike, sell another. Reduces premium but limits payoff. Used when budget constraints prevent full protection.
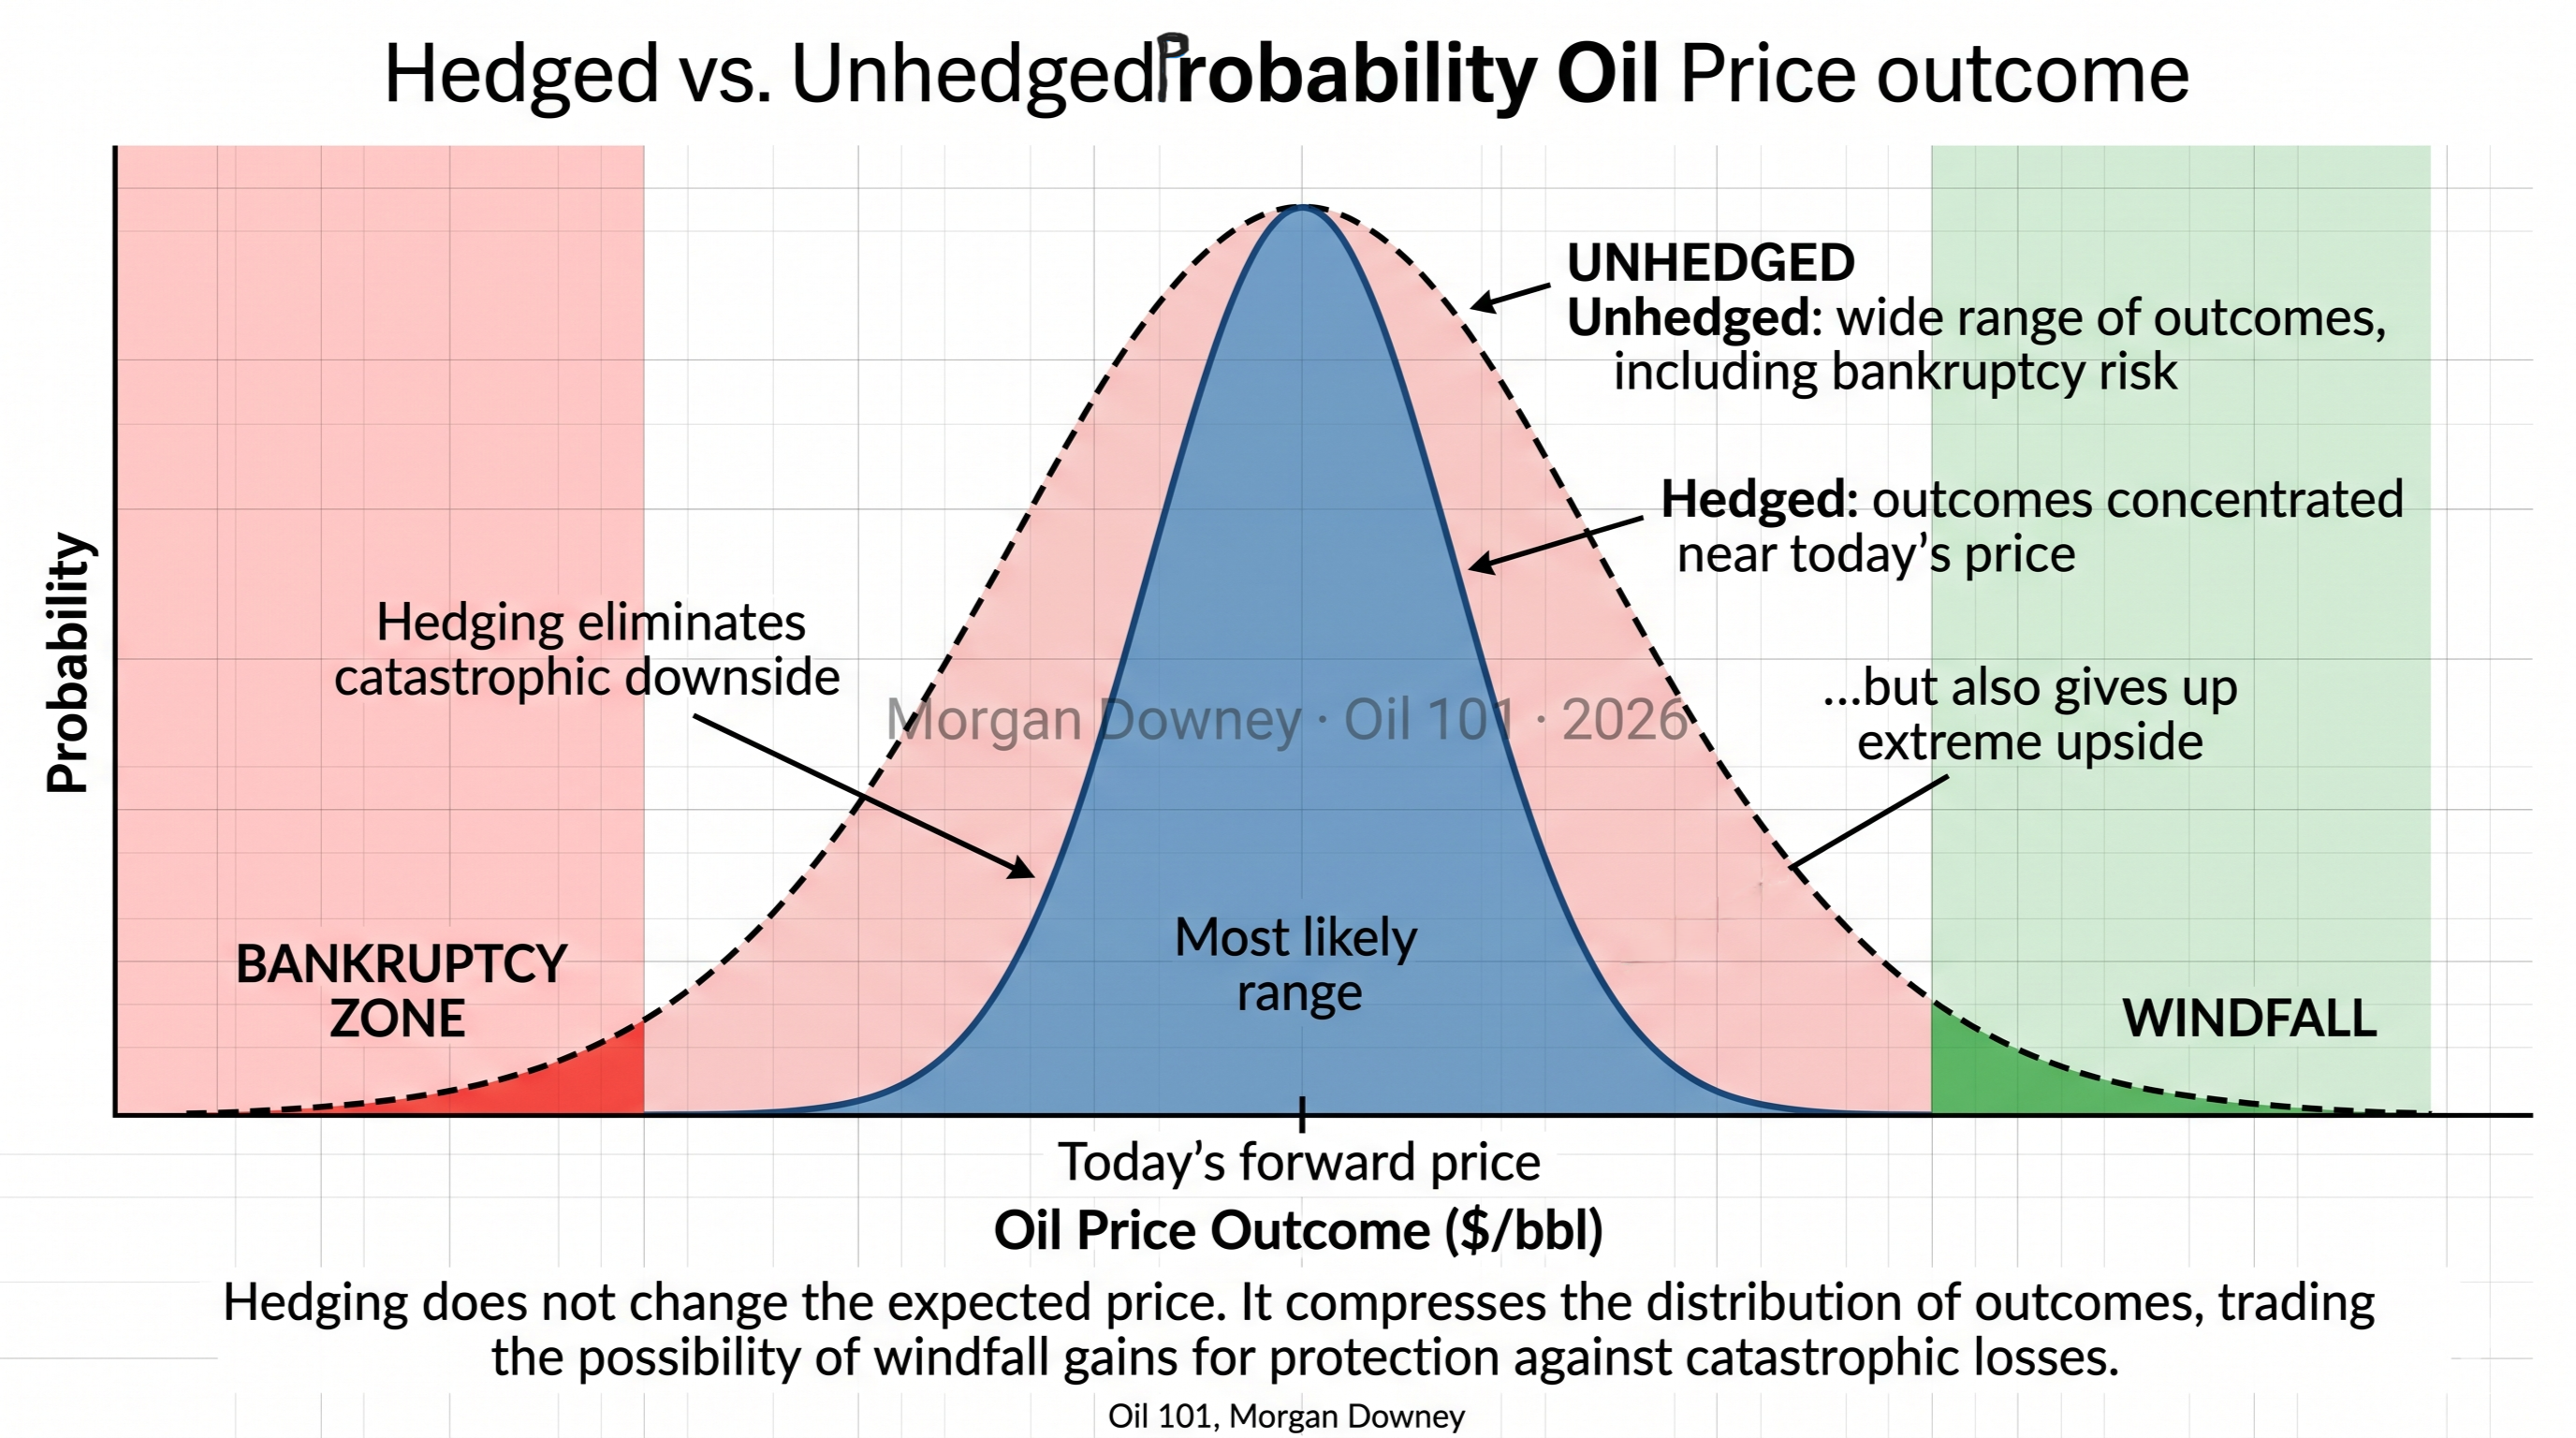
Figure 20-2: Hedging Structure Payoff Comparison
Illustrative, on a $70 forward. Swap at $70; collar long $65 put and short $80 call; three-way collar adds a short $55 put. Positive P&L means the hedge offsets a loss on physical sales.
The three shapes in that chart follow from the structures themselves. A swap moves one for one in both directions, so its bars are equal and opposite. The collar’s are not, because its two strikes sit at different distances from the $70 forward: the floor $5 below it, the ceiling $10 above. A costless collar is built by matching the two premiums rather than the two distances, and premium is not linear in distance from the forward, so equal premiums rarely produce equal gaps. Below the floor the collar tracks the swap exactly, less that $5 deductible, which is the constant 7 percentage point gap between the swap and the collar in both falling columns.
The three-way collar is the one to read slowly. Above $55 it is the same instrument as the collar, giving up the same upside above $80, which is why the two show identical bars in the rising column. Below $55 the put the producer sold cancels the put the producer bought, and the protection stops there. The payoff freezes at $10 per barrel, the width of the put spread, however far the price falls. At a 30 percent decline that barely shows, because $49 is only a few dollars through the hinge. At a 50 percent decline the collar pays three times what the three-way pays, and that difference is the tail the producer sold.
That leaves the question of why a producer would choose one at all. A payoff diagram at expiry cannot answer it, because the compensation arrives at the outset: the producer is paid for the put they sell, either in cash or in a higher ceiling than a plain collar would fund. That premium is the entire consideration for surrendering the tail. Producers carrying three-way collars into the price collapses of 2015 and 2020 found that their floors stopped working part of the way down.
Basis Risk
Basis risk is the risk that the hedge instrument does not perfectly track the physical exposure it is meant to offset. In an idealized textbook the two move together penny for penny; in practice they can diverge for months at a time, sometimes violently. Three everyday examples capture the flavor:
- A Permian producer that hedges with NYMEX WTI (physically deliverable at Cushing) carries Midland-Cushing basis risk. When Permian pipeline capacity tightened in 2018 and 2019, Midland crude traded $10 to $18 below Cushing WTI for extended stretches. A producer fully hedged at Cushing still suffered the Midland discount on every physical barrel sold.
- A Northeast US heating oil distributor that hedges with NYMEX ULSD at New York Harbor carries rack-versus-NYMEX basis. The distributor sells at the local rack plus a margin, but pays to deliver the NYMEX futures price to customers. Rack differentials can move sharply on local inventory, weather, or refinery outages.
- A North Sea producer selling physical Forties crude and hedging with ICE Brent carries grade differential risk. The BFOETM basket has evolved over time, and the individual grades inside it trade at differentials that are not themselves hedged by the Brent futures contract.
Basis risk is almost never zero. A disciplined hedging program identifies which basis is being taken, measures it historically, and either accepts it as the unhedged residual or layers a second instrument (a basis swap or a locational spread contract) on top to reduce it further.
Roll Risk: The Metallgesellschaft Lesson
A hedger who wants to lock in a long-dated price with short-dated instruments has to roll the hedge forward as each contract approaches expiry. If the curve is backwardated (front higher than back), rolling a long position earns money: the hedger sells the expiring contract high and buys the next one lower. If the curve is in contango (front lower than back), rolling a long position costs money: the hedger sells the expiring contract low and buys the next one higher. The opposite signs apply to short positions.
The canonical teaching example of roll risk going badly wrong is Metallgesellschaft Refining & Marketing (MGRM) in 1993. MGRM offered its customers long-dated fixed-price sales of heating oil and gasoline, up to ten years forward, and hedged those sales by buying rolling front-month NYMEX futures. For most of the program the curve was backwardated, so each monthly roll produced a small gain and MGRM looked like a clever risk manager. When the curve flipped to contango in late 1993 and oil prices fell, MGRM began losing money on both the physical side (because the fixed prices it had locked in looked attractive compared with the new lower spot) and on each roll. Margin calls on the futures leg reached roughly $1.3 billion. The parent company, under German accounting rules that did not recognize the economic hedge value in the physical leg, forced MGRM to liquidate the futures position at the worst possible moment, locking in the mark-to-market loss without collecting the offsetting physical gains that were still to come. The lesson every treasury and risk committee has taken from MGRM since is that hedging a long-dated exposure with a stack of short-dated instruments is a roll-risk trade first and a price trade second, and the accounting, margin, and liquidity framework around that trade has to match the economic structure, not the legal one.
Value at Risk and Expected Shortfall
Value at Risk, or VaR, is the single most widely used quantitative risk measure in commodity trading. A one-day 95% VaR of $10 million means there is a 95% statistical probability that tomorrow's mark-to-market loss on the book will be less than $10 million. It says nothing about how bad the loss is in the 5% tail that exceeds that threshold. VaR can be calculated three ways: a historical simulation of the book under the last several hundred trading days of actual price moves; a parametric approach assuming a covariance matrix and a normal distribution; and a Monte Carlo approach that draws from a modeled distribution. All three give different answers, and the difference tells you something about the tail behavior of the book.
Expected shortfall (ES), sometimes called conditional VaR, is the average loss conditional on being in that 5% tail. ES is more informative than VaR alone because it rewards distributions that are actually thin-tailed rather than just fat-bodied up to the confidence threshold. Post-Basel III most regulated institutions use ES alongside VaR, and serious commodity risk managers do the same even when regulation does not require it.
VaR has well-documented limitations. It is pro-cyclical: a quiet market produces a low VaR, which supports more position-taking, which amplifies the eventual drawdown. It assumes the covariance matrix is stable when in fact commodity correlations break under stress. And it has no answer for genuine black-swan events such as the April 20, 2020 negative WTI print. Stress testing, next, is the complement that tries to patch those holes.
Stress Testing
A stress test runs the entire book through a hypothetical scenario and reports the resulting P&L, margin call, and collateral requirement. Good stress scenarios are specific, grounded in plausible events, and cover correlation breakdowns that normal VaR would miss. A short list commonly run inside oil trading organizations:
- A multi-million-barrel Iranian or Venezuelan supply shut-in
- A 90 million barrel emergency SPR release
- A Saudi-Russia price-war replay of March-April 2020
- A full OPEC+ breakdown with voluntary cuts unwound
- A global recession demand-destruction scenario of minus 4 million bpd
- A Strait of Hormuz disruption with shipping insurance pulled
- A regional hurricane season that shuts in 25% of US refining for six weeks
Each scenario is translated into price shocks across crude, product, and calendar spread curves, vol surface shifts, and basis moves, then re-priced through the book. The output is not a probability-weighted expected loss; it is a statement of "if this happens, here is what the treasury has to fund."
Counterparty Risk and the ISDA Framework
Exchange-traded futures and cleared swaps settle daily through a central clearing house, so counterparty risk on those positions is effectively the risk of the clearing house itself, which is small. Bilateral OTC swaps, however, are a direct credit exposure between the two firms on the trade, and that is where the ISDA framework lives.
The ISDA Master Agreement is the standard legal contract that governs OTC derivatives between two counterparties. It defines events of default, netting rights, dispute resolution, and the consequences of early termination. A Credit Support Annex (CSA) sits under the Master Agreement and specifies the collateral terms: what counts as eligible collateral, what the threshold amount is before collateral starts flowing, and how often the mark-to-market is exchanged. Netting is economically critical: with netting, a firm's credit exposure to a counterparty across hundreds of trades is the net of all mark-to-market values rather than the gross of positive ones. Novation is the process of transferring an existing trade from one counterparty to a new one, usually with the consent of all three parties.
Post-Dodd-Frank, the US Commodity Futures Trading Commission requires many previously bilateral swaps to clear through central counterparties such as CME ClearPort and ICE Clear US. Central clearing replaces bilateral credit risk with clearing-house margin, which reduces default risk but also means the treasury has to post initial and variation margin in cash. A sharp move against an open position can produce an instant cash-call that the firm has to fund even if the underlying physical hedge is still performing as intended. This is why large hedging programs now run with committed credit facilities and pre-arranged margin lines that can be drawn inside the same business day.
Hedge Accounting
The least glamorous and most consequential part of corporate hedging is the accounting. US GAAP ASC 815 and IFRS 9 both permit hedge accounting, which allows the mark-to-market of a qualifying derivative to flow through Other Comprehensive Income (OCI) and hit earnings only when the underlying hedged transaction occurs. Without hedge accounting, the derivative's mark flows through P&L immediately, producing earnings volatility even when the economic hedge is working perfectly.
There are two main types. A cash flow hedge protects a forecasted future transaction such as a forecast oil sale; gains and losses on the hedge sit in OCI until the sale occurs, then reclassify to revenue. A fair value hedge protects an existing asset or liability such as fixed-price inventory; the hedge and the hedged item both run through P&L and offset. To qualify, a firm must designate the hedge at inception, document the hedging relationship, and demonstrate that the hedge is highly effective (historically a strict 80 to 125% correlation threshold; under IFRS 9 now more principles-based).
Dedesignation is the moment a hedge no longer qualifies, for example because the forecasted transaction is no longer probable or because effectiveness fails the test. On dedesignation, the OCI balance immediately reclassifies to P&L, and subsequent mark-to-market hits earnings directly. Most of the corporate hedge "blowups" reported in the financial press are really dedesignation events: the economic hedge may still be working, but accounting treatment has changed and the press covers the accounting number.
Historical Corporate Hedging Blowups and One Famous Gain
Every generation of risk managers is taught by a handful of disasters. The table below is the canonical teaching set. The last entry is the opposite of a blowup: the single largest profitable corporate oil hedge ever publicly disclosed. It belongs in the same table because it shows the same tool, used correctly, at scale.
Table 20-2: Corporate Oil and Gas Hedging Case Studies
| Entity | Year | Outcome | Root cause |
|---|---|---|---|
| Metallgesellschaft R&M | 1993 | $1.3bn loss | Roll risk on stacked front-month hedge of long-dated physical sales |
| China Aviation Oil (Singapore) | 2004 | $550M loss | Unauthorized short options writing in a rising price environment |
| Amaranth Advisors | 2006 | $6bn loss | Concentrated nat-gas calendar-spread positions; liquidity vacuum on exit |
| SemGroup | 2008 | $2.4bn loss | Short calls against physical inventory into 2008 WTI spike; margin cascade |
| Pemex (hedging program) | 2020 | +$2.5bn gain | Pemex put program paid out on COVID oil-price collapse exactly as designed |
The Pemex case is the instructive one. Mexico has run a public annual sovereign oil hedge program (often called the Hacienda hedge) since 1990, buying out-of-the-money put options on Maya and related grades for up to 300 million barrels a year of forward production. The program has had quiet years and loud years; 2020 was the loudest. When crude collapsed in the pandemic demand shock, the Pemex puts came into the money and paid out roughly $2.5 billion. The hedge did exactly what corporate hedges are supposed to do: it turned an existential price shock into a cash-flow event that the treasury could handle. That is the point of the whole chapter.
Portfolio Theory and the Efficient Frontier
The second rationale for hedging comes from portfolio theory. A company is a portfolio of volatile costs and revenues. By hedging commodity exposure, management can optimize the organization's overall return for a given level of risk. Economist Harry Markowitz called this placing a company on its "efficient frontier." The goal is not to make money from hedging, but to maximize return on capital while maintaining acceptable risk.
Peer Benchmarking: What Other Producers Are Doing
US E&P producers publicly disclose their open hedge books in every 10-K and 10-Q filing. Analysts and investors use those disclosures to benchmark peer behavior: what percentage of next year's expected production is hedged, at what average fixed price or collar range, and with what structure. In a rising-price environment these disclosures also identify which producers will have the strongest and weakest cash flow for the coming year, independent of where spot goes. A producer with 80% of next year hedged at $55 in a $90 spot market is in a very different position from one with 20% hedged at $70. The specific hedge book is easy to read and the structural signal is loud. The point of surfacing this here is simply to note that peer benchmarking is a standard input into treasury committee decisions about this year's program, and the raw data is in the filings for anyone who wants to look.
Why Some Companies Do Not Hedge
Some managers avoid hedging because they view it as speculation. This is backwards: not hedging is the speculative choice, because it subjects the company to full market volatility. Others avoid hedging because there will be periods when hedges result in cash outflows, which poorly informed investors and media characterize as "bad bets." This short-term stigma discourages hedging despite its long-term benefits.
A more considered case against hedging is made by the US supermajors. ExxonMobil and Chevron have long argued that their shareholders can diversify oil price exposure themselves more cheaply than the company can hedge it, that hedging transactions consume real money in bid-offer spreads and credit charges, and that upstream project economics are long-cycle enough that short-dated hedges do not materially change NPV. Integrated majors also have a natural vertical hedge: upstream gains during price spikes are partly offset by downstream refining and marketing margin compression, and vice versa. The argument is coherent within that business model, and the supermajors' near-zero hedge ratios reflect it. The argument does not generalize to leveraged E&P independents, whose reserve-based loan covenants and capex plans require the cash-flow stability that only a hedge program can provide.
Operational Reality
The real-world friction of running a hedge program rarely shows up in the risk textbook. Trades are executed through a mix of voice brokers, ECN platforms, and direct counterparty lines. Every trade has to be confirmed by a middle office against the counterparty's confirmation, reconciled daily, marked to market through an independent price source, and booked into both the risk system and the accounting system. The treasury manages cash for margin calls, which can spike intraday. Month-end closes require reconciliation of realized and unrealized P&L, effectiveness testing under ASC 815, and disclosure drafting for the next filing. The audit committee reviews the program annually. The board approves the hedging policy and the maximum allowable exposures and tenors. None of this is glamorous and all of it is mandatory: a hedge program that has good instruments but bad governance is more dangerous than no hedge at all, because it produces a false sense of protection.
Oil price risk management is not about predicting the future. It is about ensuring that unpredictable price movements do not undermine an organization's ability to operate, invest, and grow. The tools covered in this chapter and the preceding chapters on futures, swaps, and options provide the foundation for doing exactly that.
The above was updated in 2026. For the full original 2009 chapter, download the 1st edition 2009 PDF.