Chapter 18
Forward Oil Markets: Futures and Swaps
Oil futures and swaps explained: NYMEX WTI, ICE Brent, the forward curve, contango, backwardation, and OTC swap markets.
Paper Barrels and Wet Barrels
The spot or cash price is the price of oil for immediate delivery. A forward price is the price for delivery at a specified date in the future. Oil for future delivery is most commonly traded using exchange-traded futures contracts and over-the-counter (OTC) swap contracts. If you choose, you never have to take or make delivery of physical oil. Because you do not touch the physical market, these are called paper barrels, as opposed to wet barrels. Paper barrels are also called derivative instruments because their value is derived from physical oil prices without necessarily resulting in ownership of physical oil.
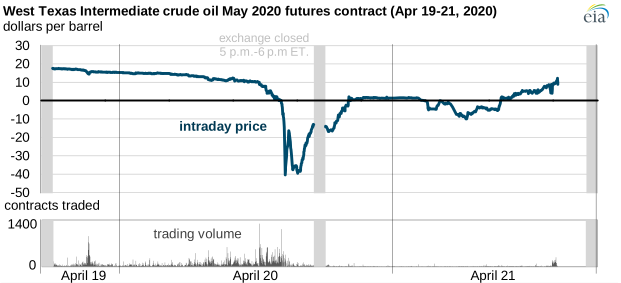
In certain circumstances, such as holding a futures contract past its expiry date, you can take or make delivery of physical oil. This link anchors paper contracts to real prices. Fewer than 1% of paper contracts convert into physical oil, but that thin thread of convergence is what keeps paper from drifting into pure abstraction. When the tether snaps, as it did at Cushing in April 2020, prices can do extraordinary things.
The Forward Curve and Its Two Shapes
Plotting forward prices across delivery dates creates a forward curve, also called a forward strip or term structure. Each benchmark grade of oil has its own forward curve. The parts of the curve closest to expiry are the front end; the parts farthest out are the back end. The price difference between one month and the next is an intermonth spread or switch. The difference between the front and the back is a time spread.
Figure 18-1: The Two Forward-Curve Shapes
Contango
Forward prices above spot
Backwardation
Forward prices below spot
Forward curves are either in contango (upward sloping, farther-out months above spot) or in backwardation (downward sloping, spot above farther-out months). Contango signals too much oil today relative to today's demand, and implies money to be made by buying spot, storing, and selling forward. Backwardation signals a relative shortage today and discourages storage by offering a better price now than in the future. Oil forward curves flip between the two shapes as physical conditions change.
Cost of Carry and Full Carry
Contango intermonth spreads are bounded by the cost of storing and financing oil. Add the monthly tank rental, the financing charge on the barrels you have bought, and the insurance, and you get the cost of carry. When the intermonth spread in contango equals the monthly cost of carry, the market is said to be at full carry. Any wider and a storage trader can lock in a riskless profit by buying spot, selling forward, and renting tanks. The arbitrage flattens the curve back toward full carry.
Backwardation has no such constraint: there is no mechanism to arbitrage a backwardated curve back to flat. You cannot borrow a barrel from the future and deliver it today. That asymmetry is why Keynes, in his 1930 Treatise on Money, called backwardation the normal state of commodity markets and coined the phrase "normal backwardation." He argued that producers hedge more than consumers and therefore must pay a premium to transfer price risk to speculators. In oil, the deeper reason backwardation dominates is structural: contango can always be traded away by building new storage, but backwardation cannot.
April 20, 2020: The Day Oil Went Negative
Marginal Finding and Development Cost at the Back of the Curve
The very back end of the oil forward curve is, in principle, the market's estimate of the finding and development cost of marginal crude barrels. If you raised capital today, explored, developed the field, and brought production to market, what price would justify the investment? Anything you can lock in beyond the five-year tenor of the curve is a rough vote on that number. In the 1990s the long-term back-of-curve price sat around $20 per barrel when conventional onshore fields were the marginal source. Since 2003 it has pushed up as marginal barrels moved toward deep offshore, oil sands, and tight oil. Back-of-curve prices are not forecasts: historically they have been poor predictors of actual spot prices over the same horizon. But they are still the best real-money signal available for long-term marginal production cost.
Spreads: How Oil Traders Actually Trade
Oil traders distinguish between flat-price (outright directional) positions and spread positions. A flat-price position is exposed to absolute up-or-down price movement. A spread position is exposed to the price difference between two things: two grades of oil, the same grade of oil in two locations, the same grade of oil in two delivery periods, or a product against its crude feedstock. The market risk of a spread is called basis risk.
Spreads are usually quoted as positive numbers, the higher price minus the lower. If you buy a positive spread, your position gains when the spread widens. If you sell a positive spread, your position gains when the spread narrows. Four common spread families dominate oil trading:
- Crack spreads (refinery margin): refined product prices minus crude oil prices, the margin a refinery earns for turning crude into fuels.
- Arbitrage spreads (arbs): the same or closely related oil priced in two regions. Arbs are primarily a function of transport rates between the two. The most famous is the WTI-Brent Atlantic arb.
- Relative value spreads (diffs): two different but closely related products in the same region, such as naphtha versus gasoline in Rotterdam, or high-sulphur versus low-sulphur diesel in the US Gulf. A regrade is a relative value spread between different grades of the same product.
- Time spreads (calendar spreads): the same grade of oil across two delivery periods. Used to trade seasonality, storage economics, and the general shape of the curve.
Figure 18-3: Brent Minus WTI Spread, Annual Average 2005 to 2025 ($/bbl)
Source: EIA, ICE, CME. The spread reflects logistics infrastructure, not oil quality differences.
The 3:2:1 and 2:1:1 Crack Spreads
The US refining industry lives and dies on the crack spread. The standard benchmark is the 3:2:1: three barrels of crude in, two barrels of gasoline out, one barrel of distillate (heating oil or diesel) out. The ratio roughly reflects the yield profile of a typical US Gulf Coast refinery running a medium crude. A refinery that sells the 3:2:1 spread forward has locked in both sides of its margin in a single trade: it has effectively bought crude and sold products at a fixed gross margin. The 2:1:1 spread (two crude, one gasoline, one distillate) is preferred for refineries whose yields lean heavier toward distillate, typically those running heavier crudes with more hydrocracker and coker capacity.
Figure 18-4: The 3:2:1 Crack Spread
Neither crack spread exactly represents any real refinery. Actual refineries have more complex slates (LPG, jet, petchem feedstocks, coke, asphalt), pay different crude diffs by grade and location, and carry energy and utility costs the simple spread ignores. But the 3:2:1 is the most widely quoted refining margin number, and it is what refinery hedgers trade when they want to lock in a margin without negotiating every barrel of every product independently.
How Fast Products Follow Crude
The spread is also a price in its own right, and it moves like one. Measured daily against WTI from 2006 to 2026, using US Gulf Coast conventional gasoline and Gulf Coast ULSD, the 3:2:1 margin has a daily standard deviation of about $1.77 a barrel against $1.79 for WTI itself. The refining margin is about as volatile from one day to the next as the crude price it is calculated from, which is the first sign that it carries information of its own rather than echoing crude.
How quickly products follow crude is measurable, and the answer tends to surprise people who expect a lag. Regressing the daily change in the product basket on the daily change in WTI across those two decades gives a coefficient of about 0.90. Products absorb roughly nine-tenths of a crude move on the same day, and the figure barely shifts, to 0.88, when the sample is restricted to days crude moved more than $3. The remaining tenth arrives over roughly two weeks. What does not appear anywhere is a delayed response: the correlation between today’s change in the crack and the change in crude one to seven days earlier sits within three-hundredths of zero at every lag.
A crack spread can still look on a chart as though it trails crude, and the reason is leverage. The tenth of a crude move that products do not pass through immediately is almost invisible in a product price and large in a margin. A $10 move in crude passing through at 90% leaves a dollar sitting in a spread whose long-run median is under $17, so the crack magnifies precisely the part of the crude move that failed to arrive. Where the news originated then sets the sign. A crude-side shock, an OPEC decision or a reserve release, moves crude first and compresses the margin. A product-side shock, a refinery outage or a cold snap that empties distillate tanks, moves products first and widens the margin while crude hardly moves at all. Read that way the spread is a diagnostic rather than a lagging indicator, and it tells a refiner which half of the barrel the market is arguing about.
The Spreads Family Tree
Benchmark grades of oil around the world are linked into a family tree by traded spreads. Light sweet crudes trade against each other, heavy crudes against lighter ones, regional benchmarks against global references. A trader arbitraging Midland WTI against Cushing is walking along one branch; a trader arbitraging Dated Brent against BFOET is walking along another. The diagram below shows the main families.
Main Spread Families Between Benchmark Grades
Exchange-Traded Futures
A futures contract gives you the right to buy or sell a standardized quantity of oil for delivery at a specified date in the future. Buying futures is called going long: the trade makes money if prices rise. Selling futures is called going short: the trade makes money if prices fall. Adding an offsetting trade in the opposite direction is called unwinding or closing out. A position that has been completely offset is said to be squared out.
Margin and the Clearinghouse
To trade futures you open an account with a broker and post an initial cash margin deposit. The broker passes that deposit to a central clearinghouse, which manages the credit of the entire exchange. The clearinghouse becomes the counterparty to every trade: buyers face the clearinghouse, sellers face the clearinghouse, and no individual trader has direct credit exposure to any other. This mutualization of credit is the single biggest structural difference between futures and OTC.
If the market moves against you, the clearinghouse issues a variation margin call, requiring you to post additional cash to cover the loss. Variation margin is collected daily, at the end of each trading session, based on the exchange's settlement price. The process is called mark-to-market: every position is revalued to the day's close and unrealized losses are converted into realized cash movements. If you fail to post variation margin, the clearinghouse closes your position and uses your initial margin to cover any residual loss.
Table 18-1: Mark-to-market lifecycle
| Stage | What happens |
|---|---|
| Open position | Trader posts initial margin with broker, 5-10% of notional contract value. |
| End-of-day settlement | Exchange publishes settlement price. Clearinghouse marks every position to that price. |
| Mark-to-market | Winners receive variation margin in cash. Losers must post variation margin in cash. |
| Margin call | If losing trader fails to post on time, clearinghouse closes the position at market. |
| Residual loss | Covered first by the trader's initial margin, then by broker capital, then by the exchange default fund. |
Initial margin of 5 to 10% of contract value means a trader can control $70,000 of oil exposure for about $5,000 in margin, roughly 14-to-1 leverage. Small price moves then create large profits or losses relative to margin posted. This leverage is why futures are viewed with fear by the general public. Traders who cannot absorb a margin call through a short adverse move are called weak hands and are regularly stopped out of positions that later move back in their favor. A trader who posts the full notional value as collateral, with the broker or in a bank account ready for margin calls, is called a strong hand and is fully collateralized. Weak hands provide the liquidity; strong hands collect it.
Worked Example: Five-Day Mark-to-Market
The table below walks through a five-day mark-to-market cycle for a trader who buys 10 WTI contracts (10,000 barrels) at $80.00 per barrel on Day 1 and holds the position through settlement each day. Each $1 move per barrel creates a $10,000 gain or loss across the 10 contracts.
Table 18-2: Five-day mark-to-market worked example
| Day | Settlement ($/bbl) | Daily change | Variation margin | Cumulative P&L |
|---|---|---|---|---|
| Day 1 | $80.00 | Entry price | Posts $50,000 initial margin | $0 |
| Day 2 | $82.00 | +$2.00 | Receives $20,000 | +$20,000 |
| Day 3 | $78.00 | -$4.00 | Pays $40,000 | -$20,000 |
| Day 4 | $79.50 | +$1.50 | Receives $15,000 | -$5,000 |
| Day 5 | $81.00 | +$1.50 | Receives $15,000 | +$10,000 |
On Day 3, the trader faced a $40,000 margin call on a $50,000 initial deposit. A weak hand unable to post would have been closed out at $78 and locked in a $20,000 loss. A strong hand who posted the call went on to recover to +$10,000 by Day 5. This is the daily cash discipline that separates futures from a buy-and-hold investment: you must be able to survive the path, not just the destination.
Maintenance Margin: The Broker Layer
Readers who met futures margin in a finance textbook may be looking for a term this account has not used: maintenance margin. It is absent from the description above because that description is of the clearinghouse layer, and at that layer there is no buffer. Every position is marked to the settlement price and the full day's loss is due in cash, with no threshold below which the clearinghouse waits. Maintenance margin lives one layer down, in the relationship between a broker and its customer. The exchange publishes a maintenance level for each contract, and a speculative customer opens a position by posting initial margin set above it, typically 110 percent of the maintenance level. Daily losses are allowed to eat into the account until the balance touches the maintenance level. At that point the broker issues a margin call, and the call is for enough cash to restore the account to the full initial level, not merely back above the threshold. The buffer exists so that the broker is not demanding a small wire transfer from every customer after every ordinary down day.
The two payments also differ in kind. Variation margin is realized profit and loss changing hands: cash the loser pays out and the winner keeps. Initial and maintenance margin are collateral: a performance bond, returned when the position is closed. The comparison table later in this chapter compresses the futures column to initial plus daily variation margin to the clearinghouse, which describes the clearinghouse layer; the maintenance mechanics sit inside the brokerage account, one step closer to the trader.
The Five Liquid Oil Futures Contracts
Globally, only five oil futures contracts carry meaningful liquidity. Three are listed in New York and two in London. Every other exchange contract is either niche, regional, or effectively a wrapper around one of these five.
Table 18-3: The five liquid oil futures contracts
| Contract | Ticker root | Size | Settlement |
|---|---|---|---|
| WTI Crude Oil (NY) | CL | 1,000 bbl | Physical, Cushing OK |
| Brent Crude Oil (London) | B | 1,000 bbl | Cash vs Dated Brent |
| RBOB Gasoline (NY) | RB | 42,000 gal (1,000 bbl) | Physical, NY Harbor |
| NY Harbor ULSD (NY) | HO | 42,000 gal (1,000 bbl) | Physical, NY Harbor |
| Gasoil (London) | G | 100 metric tonnes | Physical, ARA |
One metric tonne of gasoil is roughly 7.45 barrels. One 42,000-gallon gasoline or distillate contract is exactly 1,000 barrels, matching the WTI and Brent size so that crack spreads can be constructed one-for-one with a single contract on each leg. That design choice is not an accident: it is what makes the 1:1:1, 3:2:1, and 2:1:1 crack spreads executable as single-click trades on an exchange screen.
Figure 18-5: WTI Crude Oil Daily Volume and Open Interest, 2015 to 2025 (Million Contracts)
Sources: CME Group
Futures Ticker Format
The month codes look arbitrary because they are relics of the open outcry era. On a noisy trading floor where hundreds of traders were shouting bids and offers and flashing hand signals across a crowded pit, the letters had to be legible at a distance and impossible to confuse with numbers or with each other. That ruled out A, B, C, D, E, I, L, O, P, R, S, T, W, and Y. What remained was the odd-looking sequence F, G, H, J, K, M, N, Q, U, V, X, Z. The pits are almost all gone now, but the codes they invented still stamp every oil futures ticker on every screen in the world.
The front-month contract (the one closest to expiry) is also called the first nearby or prompt contract. The next one out is the second nearby. Contracts one, two, and three December months forward are sometimes called red, blue, and green December, a Eurodollar-desk shorthand that bled into oil in the 1990s.
Over-the-Counter (OTC) Swap Contracts
An OTC contract is similar to a futures contract: you buy and sell oil exposure for dates in the future. The differences are that OTC contracts are customizable, traded bilaterally rather than on an exchange, and almost always cash settled. The OTC market caters to large organizations rather than individuals. The International Swaps and Derivatives Association (ISDA) produces the standardized legal templates the market runs on. A typical trade confirmation is three or four pages of ISDA-style language.
The word swap captures the economics: the transaction allows oil price movement risk to be swapped from one trader to another. An airline buying a jet fuel swap is paying fixed and receiving floating, or going long a swap. An oil producer selling a crude swap is receiving fixed and paying floating, or going short a swap. Most OTC swaps settle against the monthly average of daily benchmark prices, a structure called Asian settlement or average-rate settlement. A swap that settles against a single day is a bullet swap.
A Worked Airline Swap: The Book's Signature Example
On January 10, Trader A at an airline phones Trader B at a bank. Trader A is worried about a military buildup on the border of two major oil producers and thinks jet fuel prices could rally hard in March. Trader A wants to buy 20,000 metric tonnes of Platts NWE jet fuel for the month of March. Trader B offers a fixed price of $1,510 per metric tonne. They trade at that level.
During March, the swap prices out each business day against the Platts North-West Europe jet fuel settlement. At the end of the month, the final floating leg is the simple average of those twenty business-day prints. Suppose the average comes in at $1,550.25 per metric tonne. Here are the two cash flows:
Table 18-4: Airline jet fuel swap settlement
| Leg | Airline (Trader A) | Bank (Trader B) |
|---|---|---|
| Fixed leg ($1,510 × 20,000 mt) | Pays $30,200,000 | Receives $30,200,000 |
| Floating leg (March avg $1,550.25 × 20,000 mt) | Receives $31,005,000 | Pays $31,005,000 |
| Net on April 6 | Receives $805,000 | Pays $805,000 |
Payments are netted, so no one wires $30 million. The back offices calculate the difference and the losing side wires a single net number, in this case $805,000, on the fifth business day after month end. The airline has achieved exactly what it wanted: an effective purchase of March jet fuel at $1,510 per metric tonne, regardless of where the actual market went. If the average had printed below $1,510, the airline would have paid the bank the difference and walked away with a fixed price that was, in hindsight, worse than the floating market. That regret-in-hindsight outcome is the cost of hedging, and it is the part that airline CFOs have to defend to their boards every year.
Where Futures and Swaps Differ
Table 18-5: Futures vs. OTC swaps
| Futures | OTC swaps | |
|---|---|---|
| Where traded | Exchange, five liquid contracts | Bilateral, 100+ benchmarks referenced |
| Standardization | Fixed size, fixed expiry | Customizable size and tenor |
| Settlement | Physical delivery on single day | Cash settled, usually against monthly average |
| Credit | Exchange clearinghouse mutualizes counterparty risk | Bilateral credit, governed by ISDA master agreement |
| Margin | Initial + daily variation margin to clearinghouse | Bilateral margining or credit lines between counterparties |
| Discounting | No discounting of notional cash flows | Discounted for time value of money |
Where Are the Forwards?
Readers who learned this material from older books may notice an instrument missing from the table above. The classic taxonomy had three paper contracts, not two: forwards, futures, and swaps. A forward is the oldest and simplest of the three, a bilateral agreement fixing a price today for physical delivery later, with no exchange, no clearinghouse, and no daily margin. The futures contract is a forward that was standardized and moved onto an exchange. The swap is a forward that gave up physical delivery and settles in cash. Both descendants are covered above, and what happened to the ancestor explains why this chapter is organized the way it is.
One forward market still anchors the most important price in oil. The cargoes of North Sea crude at the core of the Brent complex trade as forwards: bilateral contracts for a specific 700,000 barrel cargo loading one to three months out, under terms the trade calls the 21-day BFOETM contract. Dated Brent is assessed from those cargoes, and the ICE Brent futures contract cash-settles against an index built from them. Appendix 1 walks through the mechanics in detail. The forward survives there as infrastructure: the physical machinery inside the benchmark, traded by the few dozen companies equipped to take delivery of a full cargo, rather than a general-purpose hedging tool.
For everyone else, the forward lost its role as a hedging instrument, for three reasons. Credit came first: a forward carries full bilateral exposure on the whole notional value for the life of the trade, with no clearinghouse and no daily variation margin, and every large counterparty failure from Enron in 2001 onward made that exposure more expensive to carry. Delivery came second: most hedgers want the price exposure and not the barrels, and a cash-settled swap delivers the economics of a forward with no tankage, no scheduling, and no quality disputes. Regulation came third: the post-2008 Dodd-Frank and EMIR reforms pushed OTC derivatives toward central clearing, and in October 2012 ICE converted its entire cleared energy swap complex into futures contracts overnight, a move the market called futurization. A large share of the volume that older books counted as swaps now appears in the futures column for that reason.
There is one more place forwards seem to hide, and the appearance is deceptive. Most physical oil moves under term contracts, agreements to deliver cargoes month after month for a year or more, which sounds like a forward. But as Chapter 17 (Oil Prices) explained, term contracts are priced by formula against a benchmark at or around loading, at whatever the market is then, and almost never at a price fixed on signing. They lock in volume and leave the price floating. A term contract is a forward on barrels, not on price, which is why signing one removes no price risk and why the paper markets in this chapter exist at all.
Table 18-6: The four oil markets: what trades, how far out, how big
| Market | What trades | Typical tenor | Rough scale |
|---|---|---|---|
| Physical spot and term | Wet barrels: cargoes and pipeline batches, mostly under term contracts priced by formula | Spot cargoes load within weeks; term contracts run a year or more on floating prices | World consumption of roughly 104 million barrels per day |
| Physical forwards | North Sea cargoes at fixed prices before loading (21-day BFOETM), plus scattered fixed-price physical deals elsewhere | One to three months | A few dozen 700,000 barrel cargoes a month; a niche by volume that the Brent benchmark is assessed from |
| Exchange futures | Standardized 1,000 barrel contracts on the five liquid benchmarks | Listed roughly ten years out; liquid in the first two to three | WTI averaged about 1.2 million and Brent about 1.5 million contracts a day in 2025, together roughly 2.7 billion paper barrels a day, about 25 times world consumption |
| OTC swaps | Cash-settled, customized exposure against 100+ benchmarks, mostly monthly averages | Negotiable; one to three years is common, five and beyond needs strong credit | Roughly $2.8 trillion of notional outstanding across all commodity OTC derivatives at end-2025 (BIS), with no oil-only figure published |
Two cautions on that table. The four rows are measured in incompatible units, barrels per day of flow, cargoes per month, contracts per day, and notional dollars outstanding, so the comparison is directional rather than exact, and the OTC row is the softest: the only public estimates come from central-bank surveys of dealers that lump crude in with every other commodity. And on tenor, the practical hedging horizon is shorter than the listed one. WTI futures are listed a decade out, but open interest thins quickly beyond the second year, and a five-year producer hedge gets executed patiently, in moderate size, usually as a swap with a bank that then manages its own offset. Beyond about five years there are quotes rather than markets, which is why the back-of-curve section earlier in this chapter treats those prices as a rough vote on marginal cost rather than a tradable level.
EFP, EFS, and Block Trades
Three mechanisms bridge the exchange and OTC worlds. An Exchange for Physical (EFP) is a privately negotiated swap of a futures position against a matching physical position: two counterparties agree on a price, one side ends up with wet barrels, the other with the futures exposure, and the trade is reported to the exchange without touching the order book. An Exchange for Swaps (EFS) does the same thing between futures and an OTC swap. A block trade is a large order negotiated off-screen and then reported to the exchange, subject to minimum size thresholds. All three exist so wholesale participants can move institutional-size risk without the slippage a screen order would impose.
The Live Curve Today
The curve above is live WTI. Look at whether the first two months are in contango or backwardation, and by how much. That front-end shape is the most sensitive real-time indicator of physical tightness at Cushing, and it is the first number every crude trader checks in the morning.
The above was updated in 2026. For the full original 2009 chapter, download the 1st edition 2009 PDF.