Chapter 17
Oil Prices
How oil prices work: WTI, Brent, Dubai benchmarks, price reporting agencies, netback pricing, and what drives crude oil prices.
Physical Oil Trading
Wholesale oil trades through two types of contracts: term supply contracts (pre-arranged deliveries at scheduled dates, the majority of physical trade) and spot supply contracts (immediate delivery to the highest bidder). Spot prices reflect real-time supply and demand conditions and anchor virtually all oil pricing worldwide.
Benchmark Pricing
Until the 1980s, oil prices were set by fiat: major oil companies or OPEC producers declared a fixed price that held for weeks or months. Since the mid-1980s, nearly all oil pricing uses benchmarks, with term supply contracts referencing daily spot prices from futures exchanges or trade journals.
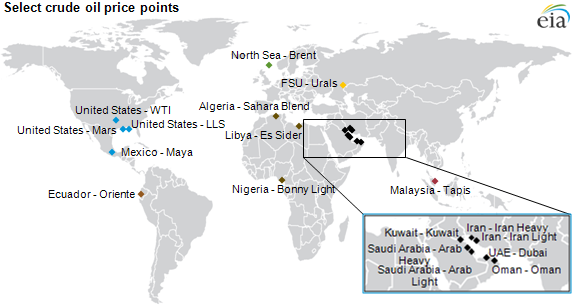
The two primary futures benchmarks are NYMEX WTI (West Texas Intermediate, traded in New York) and ICE Brent (traded in London). WTI prices roughly one-third of the world's oil; Brent prices the other two-thirds. Trade journals like Platts (now S&P Global Commodity Insights) publish daily assessments of over 100 benchmark grades based on OTC (over-the-counter) market activity.
Even OPEC producers use benchmark formula pricing. Each producer sets an Official Selling Price (OSP) as a premium or discount to a benchmark, revised monthly. For example, Nigerian Bonny Light might be priced at Platts Dated Brent plus or minus a differential that reflects quality differences and relative demand.
Table 17-1: Global Crude Oil Benchmarks (2026)
| Benchmark | Region | Venue | Role |
|---|---|---|---|
| WTI | Cushing, Oklahoma | NYMEX (CME) | US light sweet benchmark; physical delivery at Cushing |
| WTI Houston / MEH | US Gulf Coast | NYMEX, Argus AGS | Waterborne US export benchmark, priced FOB Houston |
| Brent (BFOETM) | North Sea + US Gulf | ICE Futures Europe | Global benchmark; BFOETM basket includes Brent, Forties, Oseberg, Ekofisk, Troll, WTI Midland (2023) |
| Dated Brent | North Sea | Platts assessment | Physical cargo benchmark used to price most non-US international crude |
| Murban | Abu Dhabi (UAE) | ICE Futures Abu Dhabi (IFAD) | Launched March 2021; physically delivered Middle East light sour benchmark |
| Dubai / Oman | Middle East | Platts MOC, DME (Oman) | Core Asia-bound Middle East sour benchmark |
| ESPO | Kozmino, Russia | Platts assessment | Pacific Russian medium sour; rose after 2022 sanctions diverted Urals |
| ASCI | US Gulf Coast | Argus assessment | Argus Sour Crude Index; used by Saudi Aramco for US-bound sour cargoes |
Table 17-2: Refined Product Futures Benchmarks
| Contract | Venue | Specification |
|---|---|---|
| RBOB Gasoline | NYMEX (CME) | US gasoline blendstock, NY Harbor delivery |
| NY Harbor ULSD | NYMEX (CME) | Ultra-low sulfur diesel; replaced the legacy heating oil contract in 2013 |
| ICE Low Sulphur Gasoil | ICE Futures Europe | European diesel/heating oil benchmark, ARA delivery |
| Singapore Gasoil 10ppm | Platts MOC, ICE | Asian middle distillate benchmark |
| Marine Fuel 0.5% (VLSFO) | Platts, CME | Bunker fuel benchmark introduced for IMO 2020 sulfur cap |
Front-month WTI has traded between roughly $20 and $145 per barrel since 2007. The 2008 spike, the 2014 to 2016 shale versus OPEC price war, the April 20, 2020 negative print during the pandemic demand collapse, the 2022 Russia-Ukraine spike above $120, and the range-bound $65 to $90 environment of 2024 to 2026 all make the same point: oil is costly to store, supply takes years to adjust, and short-run demand is inelastic, so prices are structurally volatile.
Dated Brent and ICE Brent
The word Brent names a family of instruments rather than a single price, and the two a reader meets most often do different jobs. ICE Brent is a futures contract: standardized 1,000-barrel lots, one contract for every calendar month listed years forward, traded nearly around the clock on ICE Futures Europe. Dated Brent is an assessment: the daily Platts estimate of what a physical North Sea cargo sells for once the terminal has assigned it a specific loading window, which is what "dated" means. A futures position can be held by anyone with a clearing account and margin. A dated cargo is 700,000 barrels of wet oil, and only a company able to lift, finance, ship and refine it can be on either side of one.
The division of labor follows from that. Physical crude prices off Dated Brent: the producer OSP formulas and term contracts that price most internationally traded crude settle against the Platts assessment, which is produced through the Market on Close window covered later in this chapter. Hedging and speculation concentrate in ICE Brent futures, because a cleared screen contract is what an airline, a bank, a producer or a fund can actually hold, and its liquidity dwarfs the physical market: the paper barrels traded on a normal day are a large multiple of the world's entire daily production, a ratio Chapter 18 (Futures and Swaps) returns to.
The two are tied together by construction. An expiring ICE Brent future delivers no cargo; it settles in cash against the ICE Brent Index, an average built from that day's trading in the BFOETM forward market, the over-the-counter market in paper cargoes of the basket grades for delivery in future months. A holder who wants physical oil can instead convert the position into a forward cargo through an EFP, an exchange of futures for physical. A forward cargo becomes a dated cargo when its loading window is assigned, and an OTC instrument called the Dated Brent CFD, a contract for differences, trades the spread between the dated assessment and the forward. Arbitrage along that chain, futures to forward to dated cargo, holds the layers within cents of one another. That chain is why a screen price set by funds and banks in London can stand behind the pricing of physical cargoes loading in Nigeria or Norway, and why the paper price cannot detach from the wet barrel for long.
The name has outlived its source. Shell named the field after the Brent goose, following its convention of naming UK North Sea fields alphabetically after seabirds, and the Brent field itself stopped producing in 2021. The stream carrying the name now loads only a trickle of cargoes, so the price called Brent is anchored today by Forties, Oseberg, Ekofisk, Troll and, since June 2023, WTI Midland from Texas. Appendix 1 walks the whole chain in detail: the BFOETM basket and its reforms, the dated assessment and the MOC process, CFDs, EFPs, and the WTI and Brent contract specifications side by side.
Why Brent and WTI Diverge
WTI and Brent are close to twins on the assay. WTI runs about 40 degrees API with roughly 0.24 to 0.4 percent sulphur; Dated Brent is nearer 38 degrees and about 0.4 percent. Brent is the slightly heavier and slightly more sour of the two, so on quality alone a refiner should pay more for WTI. For most of the last fifteen years it has paid less. The spread between them is therefore almost entirely a statement about geography, not chemistry, and it has moved in steps rather than in a trend.
From 1990 to 2004, WTI held a steady premium of about $1.57 per barrel, which is Brent sitting roughly 7 percent below WTI year after year. The reason is what Cushing was at the time. The United States was a large net importer, and the pipelines around the delivery point ran inland from the Gulf coast. WTI was the price of a barrel already delivered into the middle of the largest refining market on earth, so it carried the freight an imported barrel had to pay to get there. Location was worth about a dollar and a half.
Then the shale revolution reversed the sign. Bakken, Eagle Ford and Permian production, arriving alongside growing Canadian oil sands volumes, filled Cushing faster than it could be drained. The pipelines still pointed the wrong way, and the Energy Policy and Conservation Act of 1975 barred almost all crude exports, so the surplus could not leave the country. A landlocked glut has only one way to clear, which is on price. Brent averaged a premium of $14.88 per barrel across 2011 to 2013 and reached about $29.60 on 23 September 2011, the widest in the history of the pair.
What closed it is the part most often got backwards. The Seaway pipeline reversed direction in May 2012, carrying crude from Cushing down to the Gulf and reaching about 400,000 barrels a day by January 2013, and the Keystone Gulf Coast extension opened in January 2014. The annual average premium fell from $17.61 in 2012 to $10.57 in 2013 and $5.72 in 2014. The crude export ban was not lifted until 18 December 2015, by which time most of the narrowing had already happened. The pipelines closed that spread, and the legislation followed them.
The repeal still mattered, though it changed the mechanism rather than the level. Averages either side of it are almost identical: $4.78 from January 2014 to the repeal, and $4.26 from the repeal through 2019. What changed is what sets the number. Before, the discount was whatever it took to force a surplus into domestic refineries that had no competitor for it. After, it is bounded by the cost of moving a barrel from the Gulf coast to Rotterdam or Asia, because a discount wider than that freight is an arbitrage and a cargo sails to collect it. The spread stopped being a symptom of confinement and became a transport differential, which is why it has sat near $4 with far less drama ever since.
Two pieces of evidence confirm that reading. The first is that WTI at Houston, the MEH assessment, trades at a narrower discount to Brent than WTI at Cushing does, and the gap between the two is close to the Cushing-to-Houston pipeline tariff. Identical crude, two locations, and the difference is the pipe. The second is that WTI Midland was added to Dated Brent itself from the June 2023 cargo month, announced in June 2022 and the first non-North Sea grade ever admitted to the benchmark, with the standard cargo raised from 600,000 to 700,000 barrels to accommodate it. Brent now partly contains WTI, so the two benchmarks are formally linked rather than merely correlated.
Anyone charting this should expect two artefacts. A trend line fitted through the whole history will slope upward and mean nothing, because the series is two levels with a transition through 2005 to 2010 rather than a drift. And the single widest WTI premium ever recorded, about $22 on 22 September 2008, was the expiry-day squeeze on the expiring October contract, a one-day dislocation rather than a structural signal. For a forward view, the useful consequence is that the spread is now a freight number with a ceiling, so it is forecast from shipping economics and Gulf coast export capacity rather than extrapolated from its own past.
The Delivery-Chain Price Ladder
When physical oil prices are quoted, they are always quoted against a specific point in the delivery chain. Crude accounts for most of the eventual retail price, but each step in the refining and transportation chain adds its own margin. The names of the price points form a ladder. Not every grade follows every rung, and the order can vary, but the sequence below is the canonical framework.
From Wellhead to Retail: US vs EU
| Step | US price | EU price |
|---|---|---|
| Wellhead | $65/bbl | $70/bbl |
| Cargo FOB | $70/bbl | $73/bbl |
| Refinery gate | $73/bbl | $76/bbl |
| Rack (wholesale) | $2.05/gal | $2.15/gal |
| Dealer tank wagon | $2.30/gal | $2.40/gal |
| Retail (pre-tax) | $2.55/gal | $2.70/gal |
| Retail (all-in) | $3.45/gal | $6.50/gal |
| Tax per gallon | $0.90/gal | $3.80/gal |
Illustrative 2024-2025 averages. US = WTI-based, EU = Brent-based. Click toggle to switch units.
Unit Conversions
Oil at retail is sold in US gallons or liters, but wholesale oil trades in barrels, gallons, and metric tonnes depending on the region and the product. The conversion from metric tonnes to barrels depends on density: lighter products pack more barrels per metric tonne than heavier products. The table below gives the canonical factors and the conventional trading units by region. A few fixed relationships are always true: 42 US gallons equal one barrel, one US gallon is roughly 3.785 liters, and one barrel is roughly 159 liters or 0.159 cubic metres.
Table 17-3: Oil Market Units and Conversions
| Product | Region | Traded unit | Bbl per metric tonne |
|---|---|---|---|
| Crude oil (WTI) | Worldwide | bbl | 7.50 |
| Crude oil (Maya, heavy) | Worldwide | bbl | 6.50 |
| Gasoil / diesel / heating oil | Asia | bbl | 7.45 |
| Gasoil / diesel / heating oil | Europe | metric tonne | 7.45 |
| Gasoil / diesel / heating oil | US | US gallon | (gal only) |
| Jet fuel / kerosene | Asia | bbl | 7.88 |
| Jet fuel / kerosene | Europe | metric tonne | 7.88 |
| Gasoline | Asia | bbl | 8.33 |
| Gasoline | Europe | metric tonne | 8.33 |
| Naphtha | Europe | metric tonne | 8.90 |
| Residual fuel oil | Asia / Europe | metric tonne | 6.40 |
The barrels-per-tonne factor matters when a trader negotiates a swap: a Brent-based crude swap in Europe typically settles in dollars per barrel even though the physical cargo is measured in metric tonnes. A slightly wrong conversion factor (say, 7.58 when the right number is 7.45) compounds across millions of tonnes and can reconcile to millions of dollars over a year.
Formula Pricing: A Worked Example
Nearly all crude oil sold into the international market today is priced using a formula that references one or more published benchmarks. The formula accounts for quality differences (light vs heavy, sweet vs sour, waxy vs clean), for location differences (delivered price at the refinery gate vs loaded FOB at the export terminal), and for a residual premium or discount (the Official Selling Price, or OSP) that the producer revises monthly. The Saudi Aramco OSP announcement on the tenth of every month is one of the most watched events in the physical market.
The clearest published example is Mexico's PEMEX, which prices its three flagship crude grades against combinations of four benchmarks using publicly disclosed formulas. The formulas below are the canonical 1990s-2000s versions; the exact weights and the constant term change over time, but the structure has been stable for thirty years. WTS is West Texas Sour, LLS is Light Louisiana Sweet, Dated Brent is the Platts North Sea assessment, and US Gulf No. 6 3% is a heavy high-sulphur residual fuel oil assessment.
Table 17-4: Mexican PEMEX Crude Formulas (illustrative)
| Grade | API | Formula |
|---|---|---|
| Olmeca (light) | 39° | 0.333 × (WTS + LLS + Dated Brent) + constant |
| Isthmus (medium) | 33° | 0.4 × (WTS + LLS) + 0.2 × Dated Brent + constant |
| Maya (heavy sour) | 22° | 0.4 × (WTS + US Gulf No.6 3%) + 0.10 × (LLS + Dated Brent) + constant |
Read the Maya formula carefully: a heavy sour crude is priced against a blend of a sour crude (WTS), a residual fuel oil (US Gulf No.6 3%), and two light sweet crude benchmarks (LLS and Dated Brent) rather than against any single crude benchmark. The weights reflect what a complex refinery would actually pay for the constituent yield: heavy sour crude is really a blend of light transport fuel potential and bottom-of-the-barrel residual potential, and Maya is priced as exactly that blend. The constant term is PEMEX's monthly OSP adjustment. It moves with demand for Maya in Asia and the US Gulf and with the refining margin offered by US coking refineries, which are the natural buyer.
Most non-OPEC producers price their crude with similar formulas. OPEC producers use them too: Saudi Aramco's Arab Light OSP to Asia is priced as a differential to the average of Oman and Dubai, while Arab Light OSP to the US Gulf is priced as a differential to ASCI. The same physical cargo is therefore priced against completely different benchmarks depending on which destination buyer is on the other side.
Two distinct things are going on in these formulas and it helps to keep them apart. Several benchmarks inside one formula, as in Maya, are there to replicate the value of the barrel: the weights approximate the yield a complex refinery will get out of it, so the formula tracks the buyer’s own economics. Different benchmarks for different destinations, as in the Aramco example, are there to price against the buyer’s alternative: an Asian refiner’s next-best barrel is a Gulf medium sour priced off Oman and Dubai, while a US Gulf refiner’s is a sour crude priced off ASCI, and a seller quotes into whichever market the cargo is going to.
Neither is diversification, and the arithmetic invites that wrong reading. Averaging three benchmarks does damp the formula against a distortion in any one of them, which is a real secondary benefit and the reason a producer prefers a basket to a single thin assessment that a counterparty could push around. But it gives the producer no protection from the oil price: all four references in the Maya formula rise and fall together, so the seller’s revenue is just as exposed as it would be against one benchmark. A multi-benchmark formula reduces basis risk and argument, not price risk. Price risk is transferred with the hedges of Chapter 20, not with the pricing formula.
Freight Netback Pricing
A variation of formula pricing is freight netback pricing, used when there is no liquid benchmark at the actual pricing location. The seller takes a published benchmark price at a different location, subtracts the cost of shipping oil from that location to the pricing location (or adds it, if flowing the other way), and uses the result as the netback price. The freight leg references a published benchmark such as the Baltic Exchange tanker rate or a Platts freight assessment. Freight netback pricing is common for obscure loading ports, for landlocked pipeline points, and for spot cargoes that have to be diverted mid-voyage. It is also the basis for arbitrage decisions: a cargo will only move from point A to point B if the freight cost is less than the price difference between A and B.
Pricing Windows and the Platts MOC
The price a Platts assessment publishes at the end of a trading day is not the last observed trade: it is the value of the market at the close, estimated from a narrow window of tightly observed spot activity. The window is called the Market on Close (MOC). For most physical crude and product assessments, the MOC window is the final 30 minutes of the trading day. During the window, bids and offers and trades are reported in real time through the Platts eWindow system. Traders can bid or offer any assessable cargo, and Platts editors use the sequence of bids, offers, and trades during the window to arrive at a single published assessment for the day. The window is deliberately narrow to ensure that the assessment reflects liquidity at the close rather than stale trades from the morning.
Because published Platts assessments feed directly into billions of dollars of physical supply contracts and OTC swaps, the MOC window is where some of the most intense short-term price formation happens in the oil market. A trader who wants to nudge an assessment upward can post a bid during the window; the bid has to be backed by real willingness to transact, but it shapes the editors' read of the market. Regulatory scrutiny of the MOC process has tightened since the mid-2010s after LIBOR and other assessment benchmarks came under investigation, and Platts publishes its methodology in detail. The MOC model is now imitated by Argus, OPIS, and every major commodity price reporting agency. When a wholesale oil supply contract says "Platts MOP" (Mean of Platts high and low) or "Platts MOC," it means the assessment produced by this window.
Oil and the US Dollar
Oil trades globally in US dollars for practical reasons: the dollar is the most liquid and freely convertible currency with the lowest transaction costs. A single currency makes international price comparison straightforward and enables efficient arbitrage. If the dollar weakens against consumption currencies, oil prices rise in dollar terms, and vice versa. Producers convert dollar revenues into any currency they want immediately.
Because the dollar itself is a moving target, headline oil prices can mislead about whether oil is genuinely more or less expensive in real terms. One check is to deflate prices with an index such as the CPI, the way economists state real GDP in base-year dollars. This book uses a different check: pricing oil in gold. Gold is a traded price rather than a statistical construct, so it needs no base year, no basket and no restatements, and it has been a store of value for the entire history of the oil industry. The cost of the choice is that gold carries its own supply and demand along with the monetary signal, so the ratio answers how oil moved against gold, a harder-money question than how it moved against a consumer basket. The chart below plots WTI in dollars beside the same barrel priced in grams of gold (one troy ounce is 31.1 grams). Both lines read the same way: up means a barrel costs more.
Figure 17-4: WTI Crude Oil Priced in Gold
Since the end of Bretton Woods in 1971, a barrel of WTI has cost roughly two grams of gold on average, a figure the market more often quotes upside down as fifteen barrels per ounce. Years well above the line mark oil that was genuinely expensive in hard-money terms: the 1973 to 1981 shocks and the mid-2000s super-cycle, when a barrel cost three and a half grams or more. Years well below mark cheap oil: 2015 to 2017, and everything since 2020. The extreme is current. Gold rose past $5,000 an ounce at its late-January 2026 peak and outran even the Hormuz crisis: across 2026 so far a barrel has averaged about 0.57 grams of gold, below 2020's 0.69, previously the lowest on record, in a year when Brent touched $138. Looked at this way, the high dollar prices of the 2020s are a story about the dollar, not about oil.
Retail Price Differences
The primary driver of retail price differences between countries is government taxation, not crude oil costs. Dense European nations with mass transit alternatives can levy high fuel taxes. Low-density countries like the US, Canada, and Australia find it politically harder to tax automobile fuels. In 2026, European gasoline taxes can exceed $3 per gallon while US federal and state taxes combined average roughly $0.50 per gallon.
The above was updated in 2026. For the full original 2009 chapter, download the 1st edition 2009 PDF.