Chapter 16
New Engine Technologies
Engine technology and oil demand: internal combustion, hybrids, electric vehicles, hydrogen fuel cells, and efficiency standards.
Why Engine Technology Matters for Oil
Roughly two-thirds of global oil consumption goes to moving people and freight. Any structural shift in how engines burn fuel, or whether they burn it at all, shows up in the crude balance with a lag of years rather than months because the world's light-duty fleet turns over slowly. The average passenger car on US roads is about 12.6 years old, and a vehicle sold today will be on the road for 15 to 20 years. That is why incremental improvements in internal combustion engine efficiency have mattered as much for oil demand over the past two decades as the high-profile growth of electric vehicles: CAFE and its European and Chinese equivalents have quietly squeezed roughly a quarter of the fuel out of each new light-duty mile since 2005.
The Four-Stroke Cycle
Every reciprocating internal combustion engine on the road today is a four-stroke engine running either the Otto cycle (spark ignition, gasoline) or the Diesel cycle (compression ignition). The four strokes are intake, compression, combustion, and exhaust. On the intake stroke the piston moves down and the cylinder draws in a charge of air, or air premixed with fuel. On the compression stroke the piston rises and squeezes that charge. In an Otto engine a spark plug then ignites the compressed mixture; in a Diesel engine the compression itself raises the air temperature high enough to ignite fuel sprayed in near top dead center. Combustion drives the piston down on the power stroke. The piston then rises on the exhaust stroke to push burnt gases out of the cylinder, and the cycle repeats.
Most of what follows is about squeezing more useful work out of each cycle.
Compression Ratio and Octane
The compression ratio is the ratio of cylinder volume at bottom dead center to cylinder volume at top dead center. Higher compression extracts more work per unit of fuel because the expansion ratio after combustion is also higher, but it raises the temperature and pressure of the unburnt charge and makes the mixture vulnerable to knock, the spontaneous detonation of end-gas ahead of the flame front. Octane is the fuel's resistance to knock. The link is direct: a naturally aspirated passenger-car engine at 10:1 needs roughly 91 AKI gasoline; 12:1 needs about 93; high-boost turbocharged direct-injection engines push effective compression close to 14:1 and demand 93 AKI in the US or 98 RON premium in Europe. Chapter 8 (Standards) covers the octane numbers in detail, and Chapter 9 (Finished Products) covers how refiners blend to the required specification.
Efficiency Breakthroughs Since 2009
When the first edition of Oil 101 appeared, the typical US passenger-car engine was a naturally aspirated port-injected 2.5-liter four-cylinder paired with a four- or five-speed automatic. Thermal efficiency, the fraction of fuel energy reaching the wheels, was roughly 25% on the best production engines. Fifteen years later the same vehicle class runs a 1.5-liter turbocharged direct-injection four-cylinder paired with an eight- or ten-speed automatic, and thermal efficiency on the best production engines is 40% or better. Several overlapping technologies got the industry there:
Table 16-1: Efficiency Technologies in Modern Gasoline Engines
| Technology | What it does | Typical gain |
|---|---|---|
| Direct injection (GDI) | Fuel sprayed directly into the cylinder; enables higher compression and better cold start | 3 to 5% |
| Variable valve timing | Cam phasers adjust valve timing to match engine speed and load (VVT, VTEC, VVT-i) | 2 to 5% |
| Turbocharging with downsizing | Smaller turbocharged engine matches larger NA engine on power; runs at better BSFC at cruise | 5 to 10% |
| Cylinder deactivation | Shuts off half the cylinders at low load, cutting pumping losses | 3 to 6% |
| Atkinson cycle | Delayed intake valve closing gives a higher expansion ratio than compression ratio; used in most hybrid engines | 6 to 10% |
| Miller cycle | Similar to Atkinson but paired with a supercharger or turbo (Mazda SkyActiv, Audi, Toyota hybrids) | 5 to 8% |
| Compression ignition gasoline | HCCI / Mazda SPCCI run gasoline in a partial diesel mode at light load | up to 10%, limited production |
| 8, 9 and 10-speed transmissions | More ratios keep the engine at its best-efficiency point across more road speeds | 4 to 7% |
The 30 / 30 / 30 / 10 Heat Balance
A conventional gasoline engine's fuel energy ends up in roughly four places: about 30% into useful work at the crankshaft, 30% out the exhaust as hot gas, 30% into the cooling system as waste heat, and 10% into friction and accessory loads. Even the best production gasoline engines sold today, after all the technologies above are layered on, only move the useful-work slice to 35 to 40%. Large marine and heavy-duty diesel engines running at their best operating point continuously under high load do better: a modern slow-speed two-stroke marine diesel can reach 50%. The remaining energy still has to go somewhere. This is why waste-heat recovery, stop-start, regenerative braking, and hybridization have so much room to work: they claw back pieces of the three non-useful slices rather than trying to raise the combustion ceiling itself.
Hybrid Electric Vehicles
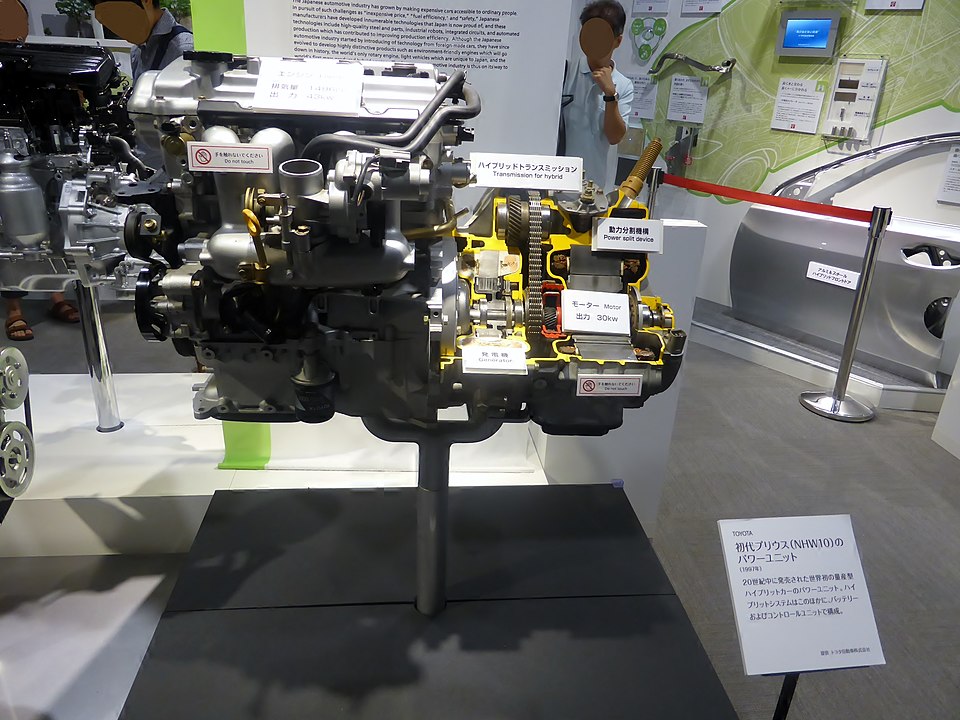
Hybrid electric vehicles (HEVs) combine an internal combustion engine with one or more electric motor-generators and a battery. Regenerative braking captures kinetic energy during deceleration and stores it in the battery, which then supplements the engine during acceleration and low-speed driving. The engine usually shuts off at stops (idle start-stop) and at low cruising speeds. HEVs get better fuel economy in the city than on the highway, the opposite of conventional cars, because stop-and-go is where regenerative braking and engine-off operation create the most value. On a long highway cruise the HEV is mostly carrying its battery pack around for nothing.
There is no single hybrid architecture. The four that account for essentially all production volume are laid out below.
Table 16-2: Hybrid Architectures
| Architecture | How it works | Example |
|---|---|---|
| Mild hybrid (48V) | 48V belt-driven starter-generator provides torque assist and captures some regen; engine still drives the wheels. | Most European luxury brands post-2018 |
| Series hybrid (EREV) | Engine only drives a generator; electric motor alone turns the wheels; battery buffers the gap. | Chevy Volt (first generation), BMW i3 REx, Li Auto |
| Parallel hybrid | Both engine and electric motor can drive the wheels through a shared transmission. | Honda Insight (first generation), many European PHEVs |
| Power-split (series-parallel) | Planetary gearset blends mechanical and electrical paths continuously; the most common mass-market architecture. | Toyota Prius, Ford Escape Hybrid, Lexus RX Hybrid |
| Plug-in hybrid (PHEV) | Larger battery (8 to 25 kWh) charged from the grid, giving 20 to 50 miles of pure electric range before the engine starts. | Toyota Prius Prime, Ford Escape PHEV, most BMW iPerformance |
Battery Electric Vehicles
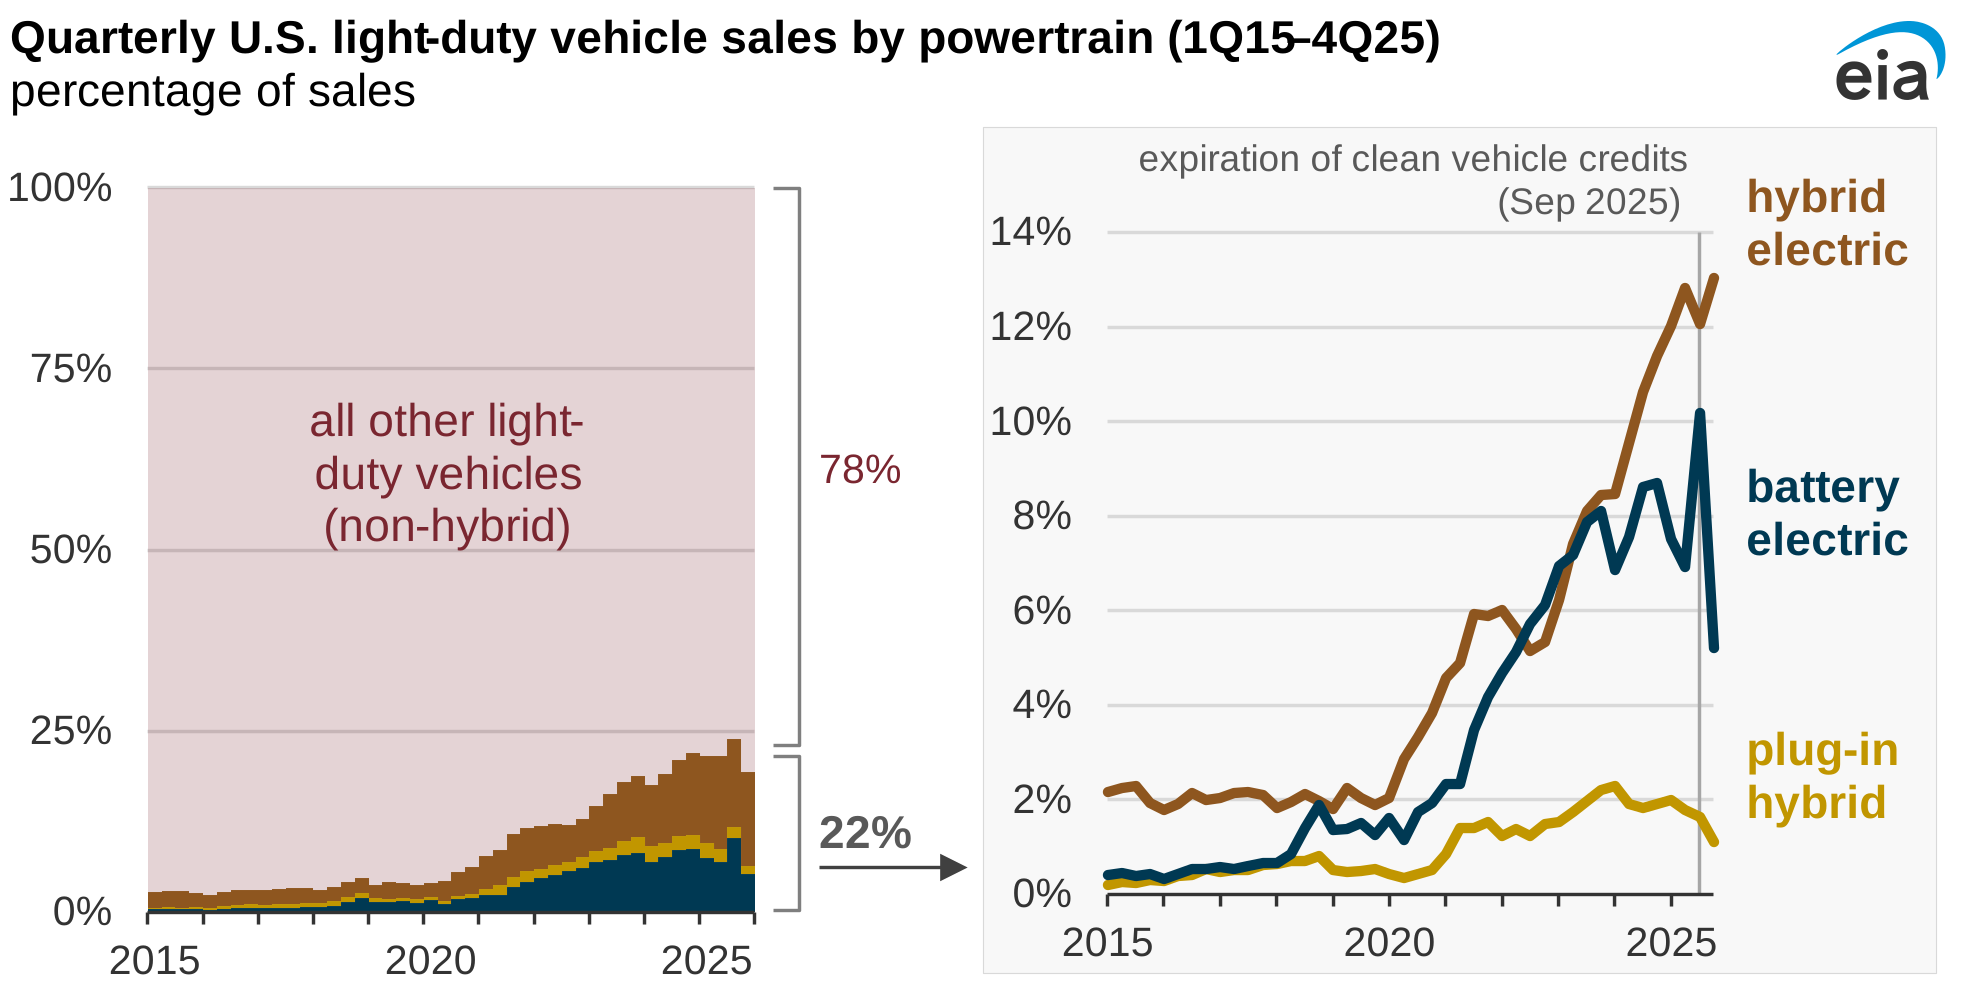
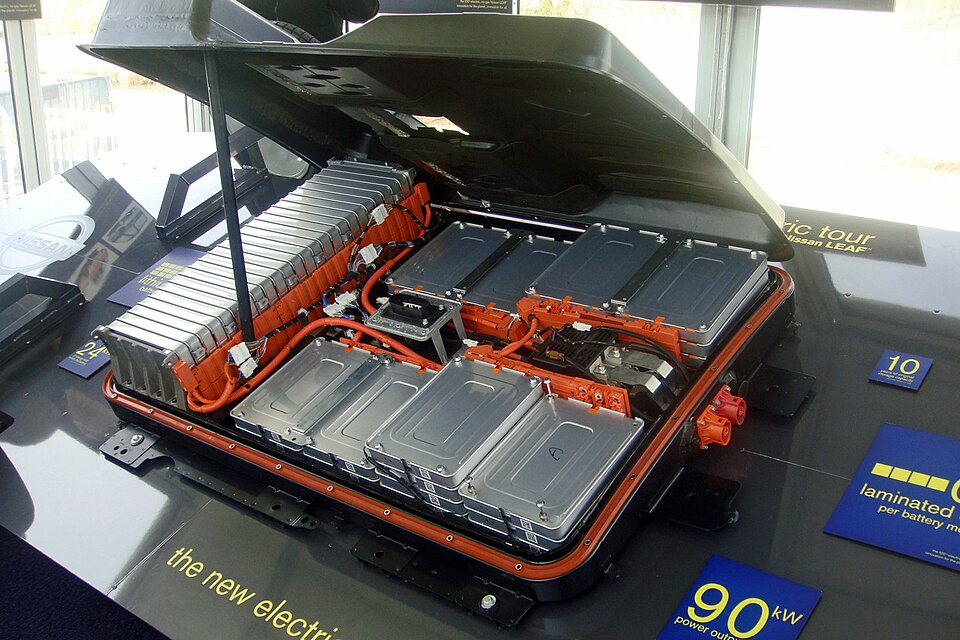
A battery electric vehicle (BEV) has no engine at all. The only energy store is a large lithium-ion battery, and the only prime mover is one or more electric motors. Global BEV sales went from a rounding error at the time of the first edition of Oil 101 to roughly 14 million units in 2024, with another 3 to 4 million plug-in hybrids on top. China is by far the largest market, with BEV plus PHEV making up over 50% of new-car sales in late 2025. Europe runs in the mid-teens to low twenties depending on the quarter and local incentive regime. The US lags the three major markets, with BEV plus PHEV share peaking around 10% in 2024 and softening in 2025 after the September 2025 federal tax-credit expiration. Globally, BEV stock is about 6 to 7% of the fleet at the end of 2025, up from under 2% in 2020.
Lithium-ion Chemistries
Not all lithium-ion batteries are the same chemistry. Three dominate the automotive market and a fourth is knocking on the door.
Table 16-3: Automotive Lithium-ion Battery Chemistries
| Chemistry | Strengths | Weaknesses |
|---|---|---|
| NMC (Nickel Manganese Cobalt) | High energy density; more range for a given pack weight; mature supply chain | Cobalt supply, thermal runaway risk, higher cost |
| NCA (Nickel Cobalt Aluminum) | Very high energy density; Tesla's long-range packs | Similar cobalt and safety trade-offs as NMC |
| LFP (Lithium Iron Phosphate) | Cheap, safe, long cycle life; no cobalt/nickel; good for standard-range models | Lower energy density; heavier pack for the same range |
| Solid-state (R&D) | Potentially higher energy density, faster charging, improved safety | Not yet in mass production at automotive scale |
One thing the chemistry does not change is how far a car travels on a kilowatt-hour. A kilowatt-hour is the same quantity of energy whatever produced it, and the drivetrain that turns it into motion runs at roughly 85 to 90% efficiency in every modern BEV, so range per kilowatt-hour is set by the vehicle's mass, aerodynamics and tires rather than by the cells underneath it. What the chemistry sets is how many kilowatt-hours fit in a given weight and volume, and what they cost. Nickel-rich cells store roughly 250 to 300 watt-hours per kilogram at cell level against roughly 160 to 200 for lithium iron phosphate, so an NMC or NCA pack carries more energy for the same mass, which is why long-range models use it. What remains of a range difference runs through weight rather than through the electricity: a heavier LFP pack of the same capacity costs a few percent of range in stop-start driving and almost nothing at a steady cruise.
The single most important battery number is pack cost per kilowatt-hour. BloombergNEF surveyed volume-weighted average lithium-ion pack prices at roughly $1,100/kWh in 2010, about $140/kWh in 2023, and around $115/kWh at the end of 2024. The industry rule of thumb is that $100/kWh is the approximate threshold at which a BEV reaches sticker-price parity with an equivalent internal combustion vehicle without subsidies. LFP packs in China have already crossed that line. The NMC/NCA packs used for long-range premium BEVs sit slightly above it.
Figure 16-4 Lithium-Ion Battery Pack Cost, 2010 to 2025 ($/kWh)
Source: BloombergNEF. The battery cost curve is the single most important driver of EV adoption.
Charging
Charging falls into three levels. Level 1 uses a standard household 120-volt outlet in North America and delivers roughly 1.4 kW, good for about 4 miles of range per hour. Level 2 uses a 240-volt circuit typical of an electric dryer, delivers 6 to 19 kW, and can refill a typical BEV battery overnight. DC fast charging bypasses the onboard charger entirely and feeds DC directly to the pack at rates from 50 kW up to roughly 350 kW on the latest equipment; the highest-power chargers can add 200 miles of range in 15 to 20 minutes on a compatible vehicle. Megawatt-scale charging standards (MCS) for heavy trucks are being deployed starting in 2024-2025 for fleet depots and long-haul corridors.
The US charging connector landscape reshuffled in 2023 when Ford, GM, and most of the remaining OEMs announced they would adopt Tesla's North American Charging Standard (NACS) in place of the CCS Combo connector. SAE subsequently standardized NACS as J3400. By 2026 essentially all new US-market BEVs ship with, or adapt to, NACS. Europe remains on CCS2, and China on GB/T.
Hydrogen Fuel Cell Vehicles
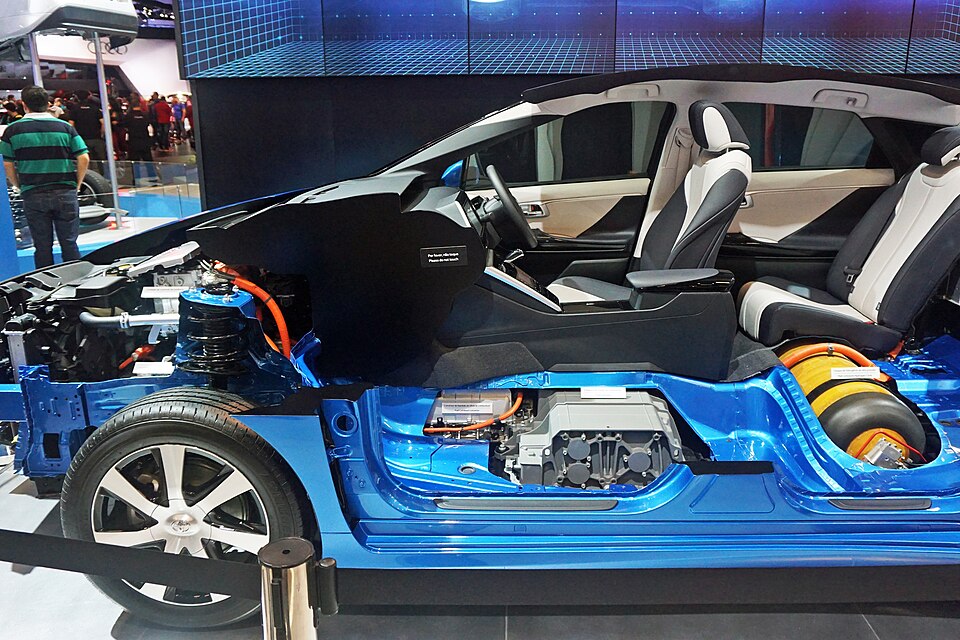
A hydrogen fuel cell combines hydrogen with atmospheric oxygen to produce electricity, water, and heat. There is no combustion and no tailpipe pollutant other than water vapor. Toyota Mirai, Hyundai Nexo, and a handful of heavy-duty truck demonstrators are the only vehicles actually sold. Fuel cell cars have not achieved meaningful volume anywhere in the world, for three reasons that have not changed since the first edition of Oil 101.
First, hydrogen storage. Hydrogen has an excellent energy-to-weight ratio but a miserable energy-to-volume ratio, as the energy density chart below shows. Even at 700 bar compressed, a tank of hydrogen carries roughly one seventh the energy of a tank of gasoline of the same volume. Cryogenic liquid storage is worse in different ways: it requires energy-intensive liquefaction, insulated tanks, and tolerates boil-off losses when the vehicle is parked.
Second, hydrogen production. Roughly 95% of the world's hydrogen today comes from steam methane reforming (SMR) of natural gas, which releases nine to ten kilograms of CO2 per kilogram of hydrogen. That is "grey" hydrogen. "Blue" hydrogen captures some of the CO2 from SMR and sequesters it. "Green" hydrogen splits water with renewable electricity in an electrolyzer and releases no CO2 at the production step, but costs two to four times more than grey hydrogen at 2025 prices. The US IRA section 45V clean-hydrogen production tax credit, worth up to $3/kg for qualifying green projects, was intended to close that gap; OBBBA in July 2025 truncated the credit window, and several announced projects have since been deferred. Chapter 25 (Energy Transition) covers the macro picture.
Third, distribution. Outside of California and a handful of demonstration corridors in Germany, Japan, and Korea, retail hydrogen refueling stations essentially do not exist. A single hydrogen station costs several million dollars to build and serves perhaps 100 vehicles a day at full utilization. The chicken-and-egg problem, which petroleum retailers themselves faced in the 1900s and 1910s, has not yet been solved for hydrogen.
Most serious analysts have moved on from passenger vehicles and now focus on industrial uses where molecular hydrogen is the actual input: ammonia production, refinery hydrotreating (see Chapter 7 (Refining)), steel direct reduction, and possibly long-haul heavy trucking and deep-sea shipping where batteries are too heavy and fueling points concentrate at a small number of large depots.
Heavy Duty and Off-Road
Passenger electrification gets the headlines, but the harder frontier is Class 8 trucks, mining haul trucks, agricultural equipment, yard tractors, and port equipment. Battery weight is a much bigger penalty here, because revenue payload comes directly out of the same gross-vehicle-weight budget as the battery pack. A typical 500-mile-range Class 8 battery-electric tractor gives up 2 to 4 tons of payload to its pack compared with a diesel equivalent. For short-haul drayage and urban delivery that trade-off already works; the Tesla Semi, Volvo VNR Electric, Freightliner eCascadia, and several Chinese heavy-duty BEVs are in production. For long-haul dry van, it is still marginal, and megawatt-scale public charging infrastructure is only beginning to appear.
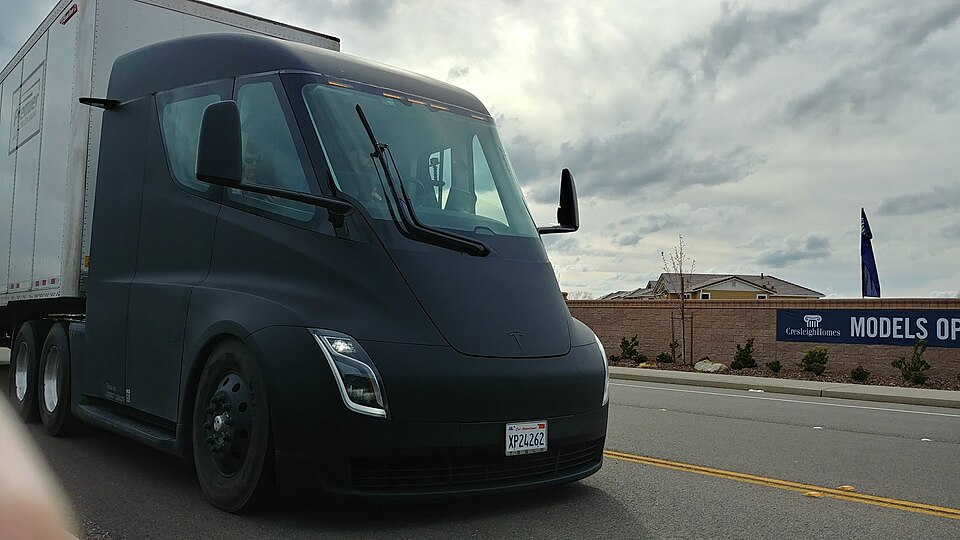
Alongside electrification, a cluster of liquid alternative fuels is being deployed to reduce the lifecycle carbon intensity of fleets that are not yet ready to electrify.
Table 16-4: Alternative Liquid and Gaseous Fuels for Heavy Duty
| Fuel | Use case | Status |
|---|---|---|
| Renewable diesel (HVO) | Drop-in replacement for petroleum diesel, made by hydrotreating vegetable oil or tallow | Commercial; California LCFS driver |
| Biodiesel (FAME) | Methyl-ester biofuel; blended up to B20 in the US, B7 in Europe | Commercial, volume-constrained by feedstock |
| CNG / LNG trucks | Compressed or liquefied natural gas in modified diesel engines | Commercial, slow growth; used by refuse fleets and some China long-haul |
| Methanol marine fuel | Dual-fuel marine diesel engines running on methanol | Commercial; Maersk, COSCO and CMA CGM have large orderbooks |
| Ammonia marine fuel | Zero-carbon hydrogen carrier burnt in modified engines | Pilot; first oceangoing ammonia dual-fuel vessels 2026 |
| Sustainable aviation fuel | Drop-in jet fuel from HEFA, alcohol-to-jet, or power-to-liquid routes (see Chapter 9 (Finished Products)) | Commercial at low blend, supply-constrained |
The Peak ICE Question
Global sales of internal combustion passenger vehicles peaked around 2017 at roughly 86 million units and have been ceding share ever since, first to hybrids and then to pure BEVs. The peak showed up in oil demand later than in unit sales, delayed by three factors: growing fleet size in emerging markets, rising SUV share within the ICE category (heavier vehicles burn more fuel), and steady replacement of older inefficient engines with newer efficient ones. Even in aggressive electrification scenarios, the existing ICE fleet of roughly 1.3 billion passenger vehicles will dominate global gasoline and diesel demand until at least 2040, because fleet turnover is slow and because commercial vehicles turn over more slowly than passenger cars. Chapter 25 (Energy Transition) picks up the energy-transition thread at the fleet and policy level; Chapter 8 (Standards), Chapter 9 (Finished Products), and Chapter 15 (Environmental) cover the specification and policy machinery that drives what rolls off the assembly line.
The above was updated in 2026. For the full original 2009 chapter, download the 1st edition 2009 PDF.