Chapter 19
Forward Oil Markets: Options
Oil options explained: calls, puts, collars, three-way structures, Black-76 pricing, Greeks, and volatility skew in energy markets.
Options as Insurance
An option is the right, not the obligation, to buy or sell oil at a set price (the strike) in the future. The buyer pays an upfront premium to the seller. If the market never moves past the strike, the buyer walks away having lost only the premium. This asymmetric payoff is why options are compared to insurance policies: you pay a fixed premium today, and in exchange you are protected against a specific kind of price move in the future.
A call option profits when prices rise above the strike. Airlines, shipping companies, and other oil consumers typically buy calls to cap their exposure to rising fuel costs. A put option profits when prices fall below the strike. Oil producers typically buy puts to protect revenue against falling prices. The maximum loss for an option buyer is the premium paid. The seller (also called the writer) keeps the premium but faces potentially unlimited losses and is usually required to post margin that changes as the option's value changes.
Figure 19-1: Option Payoff at Expiry
Intrinsic Value, Time Value, and Moneyness
The price of any option has two components. Intrinsic value is how much the option would be worth if it expired right now: positive for options that are already favorable, zero for options that are not. Time value is everything else: the premium market participants will pay for the possibility that the option becomes more valuable before expiry. Time value is highest at the money and decays to zero as expiry approaches, a process called theta decay.
Traders describe every option's relationship to the current market in one of three ways, collectively called moneyness. An option whose strike is set exactly at the current market price is at the money (ATM). An option whose strike is already favorable to the holder is in the money (ITM) and has positive intrinsic value. An option whose strike is unfavorable is out of the money (OTM) and has zero intrinsic value, so its entire premium is time value.
Table 19-1: Moneyness with WTI Trading at $70/bbl
| Option | Strike | Intrinsic | Moneyness |
|---|---|---|---|
| Call | $60 | $10.00 | Deep ITM |
| Call | $70 | $0.00 | ATM |
| Call | $80 | $0.00 | OTM |
| Put | $80 | $10.00 | Deep ITM |
| Put | $70 | $0.00 | ATM |
| Put | $60 | $0.00 | OTM |
Intuitively, deeper-in-the-money options command higher premiums because more of their value is intrinsic rather than speculative. Out-of-the-money options are cheaper but require a larger move in the underlying before they pay out anything.
Option Styles
Oil options expire in one of four styles. American options can be exercised at any time before expiry and are the standard on futures exchanges. Asian (average price) options settle against the arithmetic mean of daily prices over a period and are the most common OTC type: they match the ratable consumption and production patterns of hedgers, and they are cheaper because averaging reduces the effective volatility. Lengthening the averaging window from a month to a quarter makes an Asian option cheaper still. European (also called bullet) options exercise only at expiry against a single price. They are rarely used in oil markets. Bermudan options exercise only during defined time windows and are also rare.
Exchange-traded oil options typically assign into a futures position at expiry if the holder exercises: the option does not pay cash directly, it hands the holder a long or short futures contract that then has to be closed. OTC options are almost always cash-settled and support more exotic structures, including compound options (options on options) and swaptions (options that exercise into an OTC swap).
Pricing: Black-76 and Implied Volatility
Options are priced using mathematical models, most commonly a version of Black-Scholes adapted for commodities called Black-76. The six inputs are underlying price, strike, time to expiration, volatility, risk-free interest rate, and whether the option is a call or a put. The model assumes log-normal price changes and the ability to continuously rehedge, both imperfect approximations. Despite the simplifications, Black-76 remains the dominant model in oil options because it gives a closed-form answer in microseconds. Monte Carlo simulation offers more realism at orders of magnitude more computation and is reserved for exotic payoffs.
Of the six inputs, five are directly observable. Only volatility has to be estimated. Given an observed market option price and the other five inputs, a trader can solve the Black-76 equation backwards to find the volatility number that reproduces that price: the implied volatility. Implied vol is what option traders actually trade. It is actively quoted, marked to market, and recorded on its own forward curve.
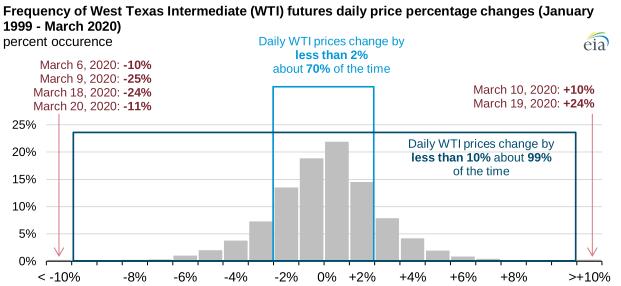
The CBOE OVX index measures 30-day implied volatility of WTI crude options, as the VIX does for the S&P 500. Crude vol normally runs in the 25 to 40 percent range, well above equity vol, but spikes during supply or demand shocks: above 100 percent during the 2008 financial crisis, above 300 percent on April 20, 2020 when WTI settled negative, above 70 percent in March 2022 after Russia invaded Ukraine, and back into the 30s during the calmer 2024 to 2026 period. Hedgers pay more for protection precisely when they need it most, which is why the cost of buying insurance goes up exactly when the insured event becomes more likely.
Figure 19-3: CBOE OVX (Oil VIX) Implied Volatility, 2007 to 2025
Source: CBOE OVX Index. Quarterly averages, illustrative. Peak intraday OVX exceeded 300 in April 2020.
The Greeks
A trader running a book of hundreds or thousands of options needs a compact way to summarize risk across all of them. The Greeks are the answer: each one is a partial derivative of an option's value with respect to one of the Black-76 inputs, and together they tell the trader how the book will respond if any input moves. The five Greeks that matter for oil are Delta, Gamma, Vega, Theta, and Rho. Throughout the examples below, assume 1 million barrels notional on a 90-day WTI ATM option struck at $70 with 35 percent implied volatility.
Delta is the option's exposure to the underlying oil price. Delta is quoted in barrels (or gallons or tonnes) and tells the trader how much the position makes or loses for a one-dollar move in WTI. An at-the-money option has a delta of roughly 50 percent of its notional. In our example, long the $70 call against 1 million bbl notional gives a delta of roughly +500,000 barrels: the position makes $500,000 if WTI rises one dollar and loses $500,000 if it falls one dollar. In-the-money options have deltas above 50 percent, out-of-the-money options below it. A trader hedging an option book usually offsets delta by buying or selling futures in the matching barrel amount.
Gamma is the rate of change of delta. If oil moves a dollar, gamma tells you how much the delta of the position itself changes. Gamma is largest for at-the-money options and shrinks for deep ITM or OTM strikes, which is why ATM options are the most sensitive to realized volatility. Gamma is why a delta-hedge is never permanent: as the market moves, the delta drifts and the hedge must be re-struck. Gamma matters most in oil because oil can gap (move in large jumps with no intervening trades) after pipeline outages, OPEC surprises, or geopolitical shocks, and each gap forces the hedge to be rebalanced at a worse price than the model assumed.
Vega is the sensitivity of the option to implied volatility. Vega is quoted in dollars per 1 percent move in vol. On our $70 ATM call against 1 million barrels, a 1 percentage point rise in implied vol might be worth roughly $120,000 to a long position. Vega is a big deal in oil because implied vol itself moves a lot: a 5 point move in OVX in a single week is routine, and 20 point moves happen during shocks. Traders who want to take a pure view on volatility regardless of direction buy or sell straddles, which have roughly zero delta but large vega.
Theta is the decay in an option's value due to the passage of time. Every day that nothing happens, a long option loses a little bit of premium. Theta is shown as a dollar amount per calendar day. The trader who is long options pays theta and is long gamma: time decay is the cost of holding convexity. The trader who is short options earns theta and is short gamma: each morning the short collects a bit of decay in exchange for taking on the risk that the market moves enough to overwhelm it. Theta is always highest for at-the-money options near expiry, which is why the last two weeks of an option's life are the most dangerous for short positions.
Rho is the change in an option's value for a change in the risk-free interest rate, typically quoted per 50 basis points. In oil markets rho is the smallest of the Greeks by a wide margin: interest rates move slowly and oil options are mostly short-dated, so the interest-rate sensitivity rarely dominates a trader's thinking. Rho becomes relevant only for long-dated structures such as multi-year airline hedges or upstream financing deals where the interest-rate component of carry starts to matter.
Figure 19-4: Option Greeks Across Strikes
Underlying $70, implied vol 35%, 90 days to expiry, 1 MM bbl notional
A gamma map (also called a strike map) lays out a portfolio's Greeks across strikes, tenors, and price scenarios so the trader can see where risk concentrates. Books that look flat on a summary view can hide large exposures at specific strike-and-expiry combinations, and the gamma map is how those hidden exposures get found. Besides the five first-order Greeks above, traders watch second-order Greeks like volga (the volatility of volatility) and vanna (the change in delta for a change in volatility), but these are refinements on the same theme.
Volatility Skew, Smile, and Surface
If Black-76 were literally true, every strike at a given expiry would trade at the same implied volatility. It does not work that way in real markets. Plotting implied vol against strike at a fixed tenor almost always produces a curve, not a flat line. In oil, that curve is usually a put skew: deep out-of-the-money puts trade at higher implied vols than ATM options because dealers charge more for crash protection. A milder call skew sometimes appears when upside shock risk is in the news. The shape is called a smile when the curve rises symmetrically on both sides of ATM, and a smirk when one side is much steeper than the other.
Plotting implied vol against time to expiry for ATM options produces the volatility term structure. In a calm market, long-dated options trade at slightly higher vol than short-dated ones, reflecting uncertainty that accumulates with time. In a shock, the term structure can invert: front-month vol spikes above back-month vol because the market expects the crisis to be resolved one way or another within weeks.
Combining the skew at every tenor into a single picture produces the volatility surface: implied vol as a function of both strike and tenor, usually rendered as a three-dimensional heat map. The surface is how every professional options desk represents its inventory. Every morning, traders mark the surface to the closing prices of actively-traded strikes and interpolate the rest.
Figure 19-5: Implied Volatility Skew and Term Structure
Skew: vol vs strike, fixed 90-day tenor
Term structure: ATM vol vs months forward
Daily Breakeven and Gamma Trading
A useful sanity check on any long-option position is the daily breakeven: how much does the underlying have to move each day, on average, for gamma gains on a delta-hedged position to cover the theta cost? The formula falls out of Black-76 and is clean enough to do in your head.
Daily breakeven = σ × P / √256
At $80 oil and 35 percent implied vol, daily breakeven is 0.35 × 80 / 16 ≈ $1.75 per barrel per day. A long-gamma position pays for itself if realized daily moves average at least $1.75. The divisor 16 is the square root of 256, the conventional number of trading days per year. Use √52 ≈ 7.2 for a weekly breakeven instead: at the same inputs, that works out to roughly $3.89 per barrel per week.
Gamma trading is the practice of being long gamma (usually long ATM options) while aggressively re-hedging delta on every meaningful move. The trader is betting that realized volatility will exceed implied volatility: if the market actually moves more than the daily breakeven implies, the gamma rebalances earn more than theta decays, and the position ends the day in the money even if the strike never gets touched. Long gamma positions do well in choppy markets and badly in quiet ones. Short gamma (short ATM options, usually in size) is the opposite bet and is how a lot of premium is earned during quiet periods, with occasional catastrophic losses when an unexpected shock arrives.
Common Option Structures
Single options are rarely traded alone in the oil hedging world. Most real positions are structures: small portfolios of two, three, or four options designed to produce a particular payoff profile at a particular cost.
The single most common structure is the zero-cost collar, also called a fence, tunnel, min-max, risk reversal, or cylinder. A producer buys a put for downside protection and simultaneously sells a call that caps the upside; the strikes are chosen so that the sold call premium exactly offsets the bought put premium, producing no upfront cash. The collar locks the producer into a band: if oil finishes below the put strike, the put pays out; if oil finishes above the call strike, the producer gives up the excess upside; if oil finishes between the strikes, the structure does nothing at all. Consumers do the mirror image: long a call, short a put.
A three-way collar adds a third leg below the bought put: the producer also sells a deeper out-of-the-money put. The extra premium lets the producer pick a tighter collar for the same zero cost, but at a hidden cost: below the sold put strike, the producer is fully exposed to further downside again. In years when budget discipline is more important than tail protection, three-ways are common. In years when a cliff-edge crash is the concern, producers prefer plain collars.
A call spread (long a near-the-money call, short a higher-strike call) reduces premium in exchange for a capped payoff. Consumers use it when they want partial protection against rising prices without paying for unlimited upside. A put spread does the same for producers in the downside direction. A straddle (long both a call and a put at the same strike) is a pure volatility trade: it pays off if oil makes a big move in either direction and loses the combined premium if oil settles near the strike.
Figure 19-6: Common Option Structures
The chart's second view answers the question a hedger should ask of any structure: what do my cash flows look like once this is added to the barrels I already produce or consume? Viewed alone, a collar's payoff diagram looks like a speculative position, short above $80 and long below $65. Added to a producer's unhedged exposure, it becomes a band: whatever the market does, the producer realizes between an effective $65 and an effective $80 per barrel. The same view shows the three-way collar's hidden cost at a glance, because below the sold put the net line turns down and runs parallel to the unhedged line again. The net line is the one that reaches the hedger's income statement, and it is the line a board should be shown when a hedging program is approved.
The right structure depends on the hedger's goals: how much downside is unacceptable, how much upside the hedger will give up, what the budget is, and what view (if any) the hedger has on volatility. None of these structures is inherently better than the others. They are a vocabulary for shaping cash-flow distributions, and the same underlying intuition from Chapter 20 (Risk Management) decides which one to use.
The above was updated in 2026. For the full original 2009 chapter, download the 1st edition 2009 PDF.