Chapter 24
US LNG Exports
US LNG exports: how America went from net gas importer to the world's largest LNG exporter in a decade, reshaping global energy.
From Net Importer to Largest Exporter
As recently as 2005, the United States was building liquefied natural gas import terminals as fast as FERC could approve them. The consensus view: US gas production had peaked, Henry Hub prices would climb structurally, and the country would grow steadily more dependent on imported LNG from Qatar, Trinidad, Algeria and Nigeria. In a single twelve-month stretch in 2005 and 2006, FERC approved or re-approved a queue of regasification projects along the Gulf Coast and Atlantic seaboard: Sabine Pass in Cameron Parish, Louisiana; Cove Point on Chesapeake Bay in Maryland; Freeport on Quintana Island, Texas; Cameron in Hackberry, Louisiana; and Lake Charles in Calcasieu Parish, Louisiana. Billions were spent on vaporizers, storage tanks, and import jetties designed to move gas one way only.
Global LNG Trade (2024)
LNG Supply by Country
LNG Imports by Region
Global LNG Trade Volume, 2000 to 2024
Within five years, every one of those assumptions was wrong. Shale gas, starting in the Barnett and accelerating through the Marcellus in Appalachia, the Haynesville in north Louisiana, and Permian associated gas in west Texas, produced a structural surplus. Henry Hub, which had traded above 8 dollars per MMBtu as recently as 2008, fell below 2 dollars. The new regasification terminals ran empty. The price signal was unambiguous: the US had more natural gas than it could consume domestically, and the surplus needed an outlet.
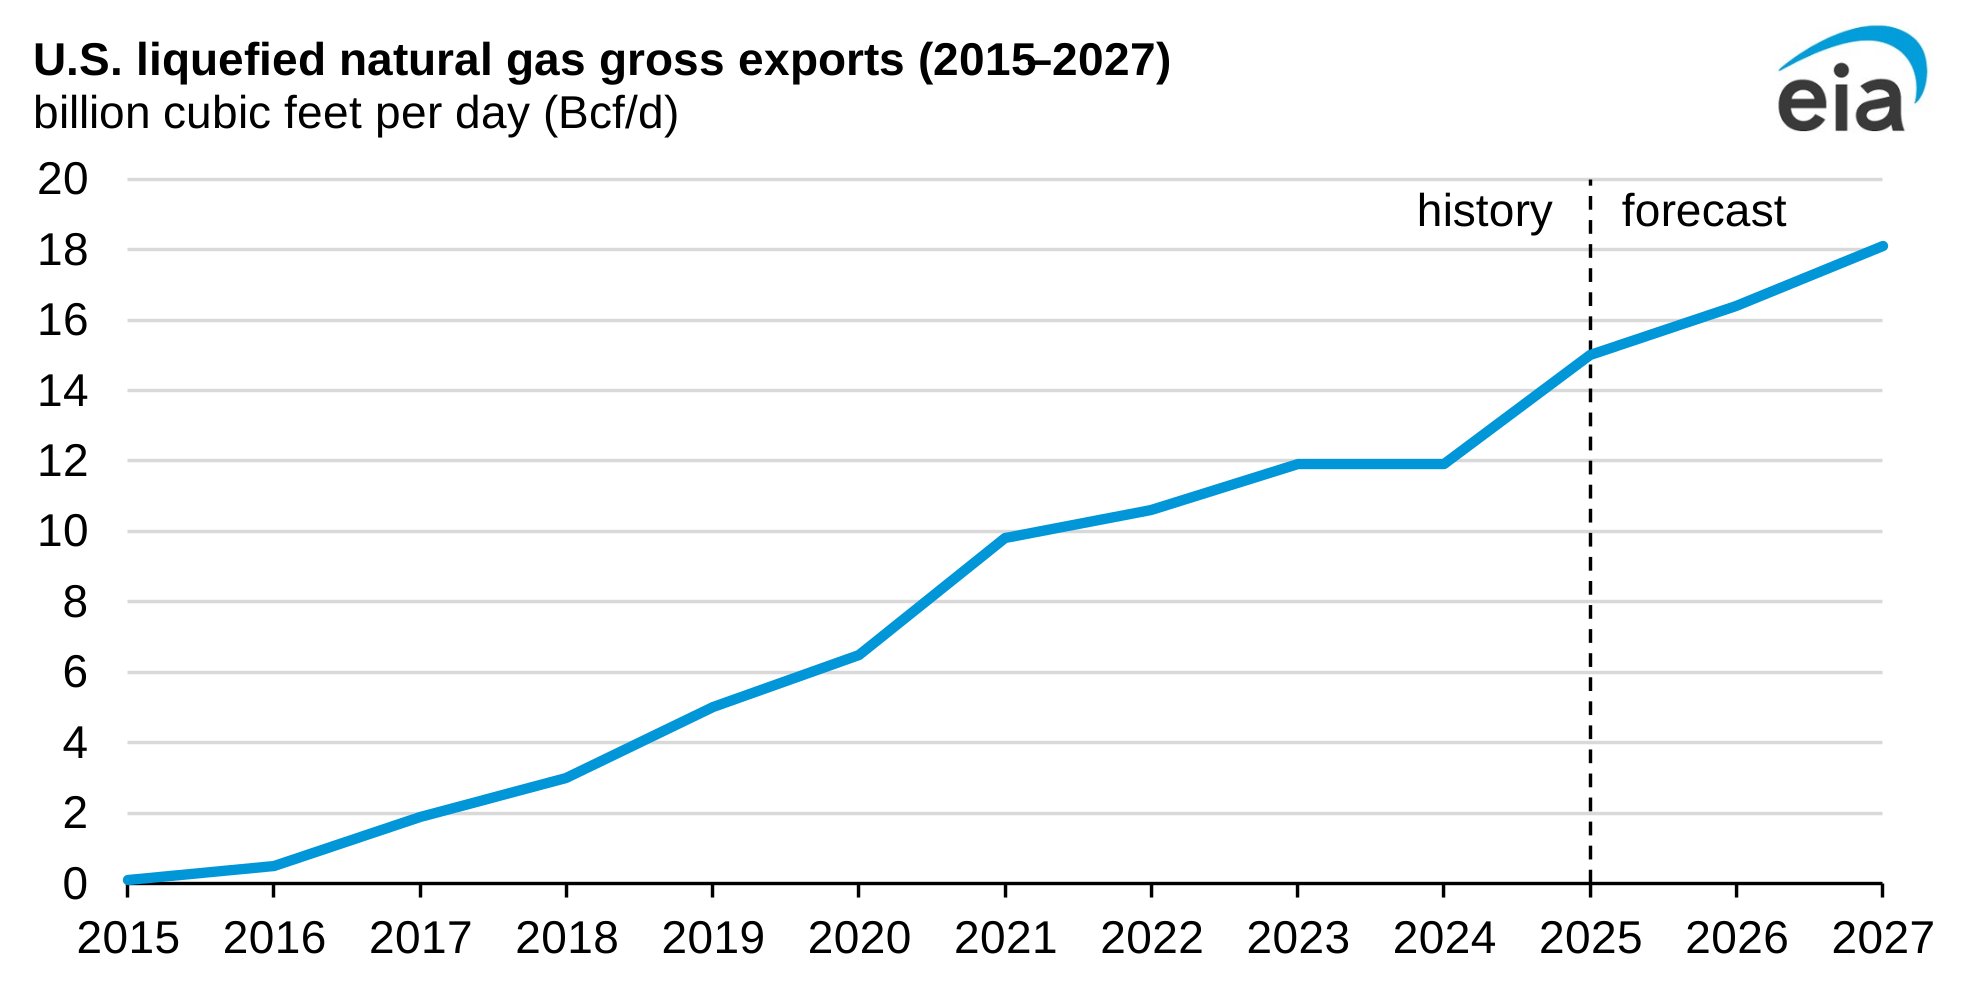
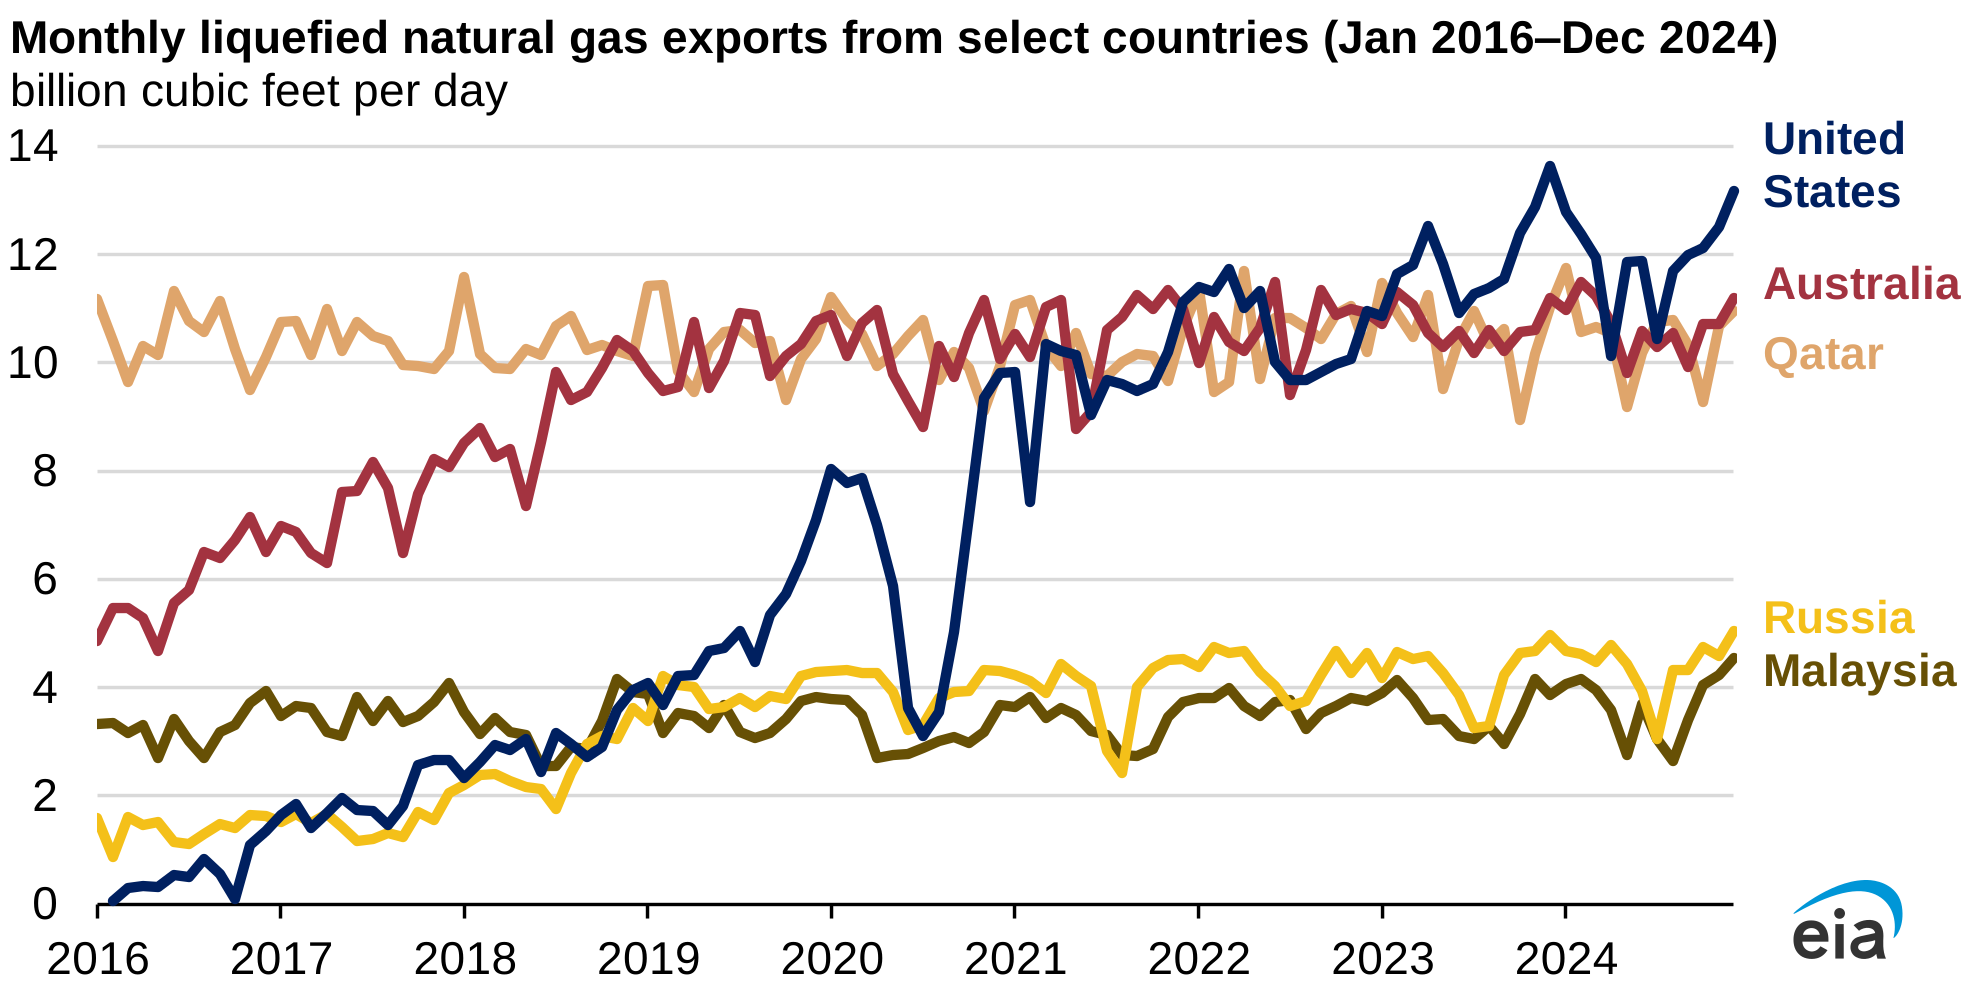
Cheniere Energy, led by the entrepreneur Charif Souki, was the first to pivot. Cheniere applied to the Department of Energy in 2010 for a license to export from Sabine Pass as LNG, received FERC construction approval in April 2012, and broke ground on its liquefaction trains while its import jetty still sat idle. On February 24, 2016, the tanker Asia Vision loaded the first commercial LNG cargo ever shipped from the contiguous United States at Sabine Pass and set a course for Petrobras in Brazil. It was the moment the US became an LNG exporter. Within eight years the country would be the largest LNG exporter in the world, ahead of both Qatar and Australia.
The Operating US LNG Fleet
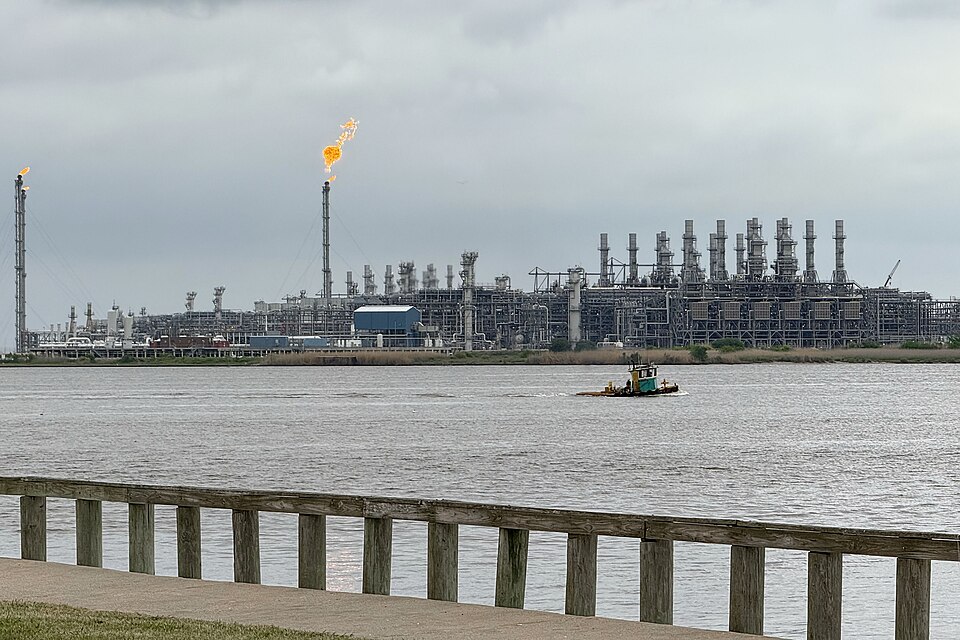
By the middle of 2025 the United States had eight operating large-scale liquefaction terminals strung along the Gulf Coast plus Cove Point on Chesapeake Bay and Elba Island near Savannah. Nameplate capacity on a peak basis was roughly 14 Bcf per day, with average feed-gas deliveries running a little below that on routine maintenance and outage cycles. Several of the original 2005-era import terminals that were rebuilt as liquefaction plants are now the backbone of the US export fleet.
Table 24-1: Operating US LNG export terminals
| Facility | Location | Operator | Nameplate (MTPA) | Nameplate (Bcf/d) | First Cargo |
|---|---|---|---|---|---|
| Sabine Pass (T1 to T6) | Cameron Parish, Louisiana | Cheniere | 30.0 | 4.0 | Feb 2016 |
| Cove Point | Lusby, Maryland | Berkshire Hathaway Energy | 5.25 | 0.82 | Apr 2018 |
| Corpus Christi (T1 to T3) | San Patricio County, Texas | Cheniere | 15.0 | 2.1 | Dec 2018 |
| Cameron | Hackberry, Louisiana | Sempra | 12.0 | 1.7 | May 2019 |
| Freeport | Quintana Island, Texas | Freeport LNG | 15.0 | 2.1 | Sep 2019 |
| Elba Island | Chatham County, Georgia | Kinder Morgan | 2.5 | 0.35 | Dec 2019 |
| Calcasieu Pass | Cameron Parish, Louisiana | Venture Global | 10.0 | 1.4 | Mar 2022 |
| Plaquemines (Phase 1 and 2) | Plaquemines Parish, Louisiana | Venture Global | 20.0 | 2.7 | Dec 2024 |
| Corpus Christi Stage III | San Patricio County, Texas | Cheniere | 10.0 (phased) | 1.4 | Dec 2024 |
The Second Wave Under Construction
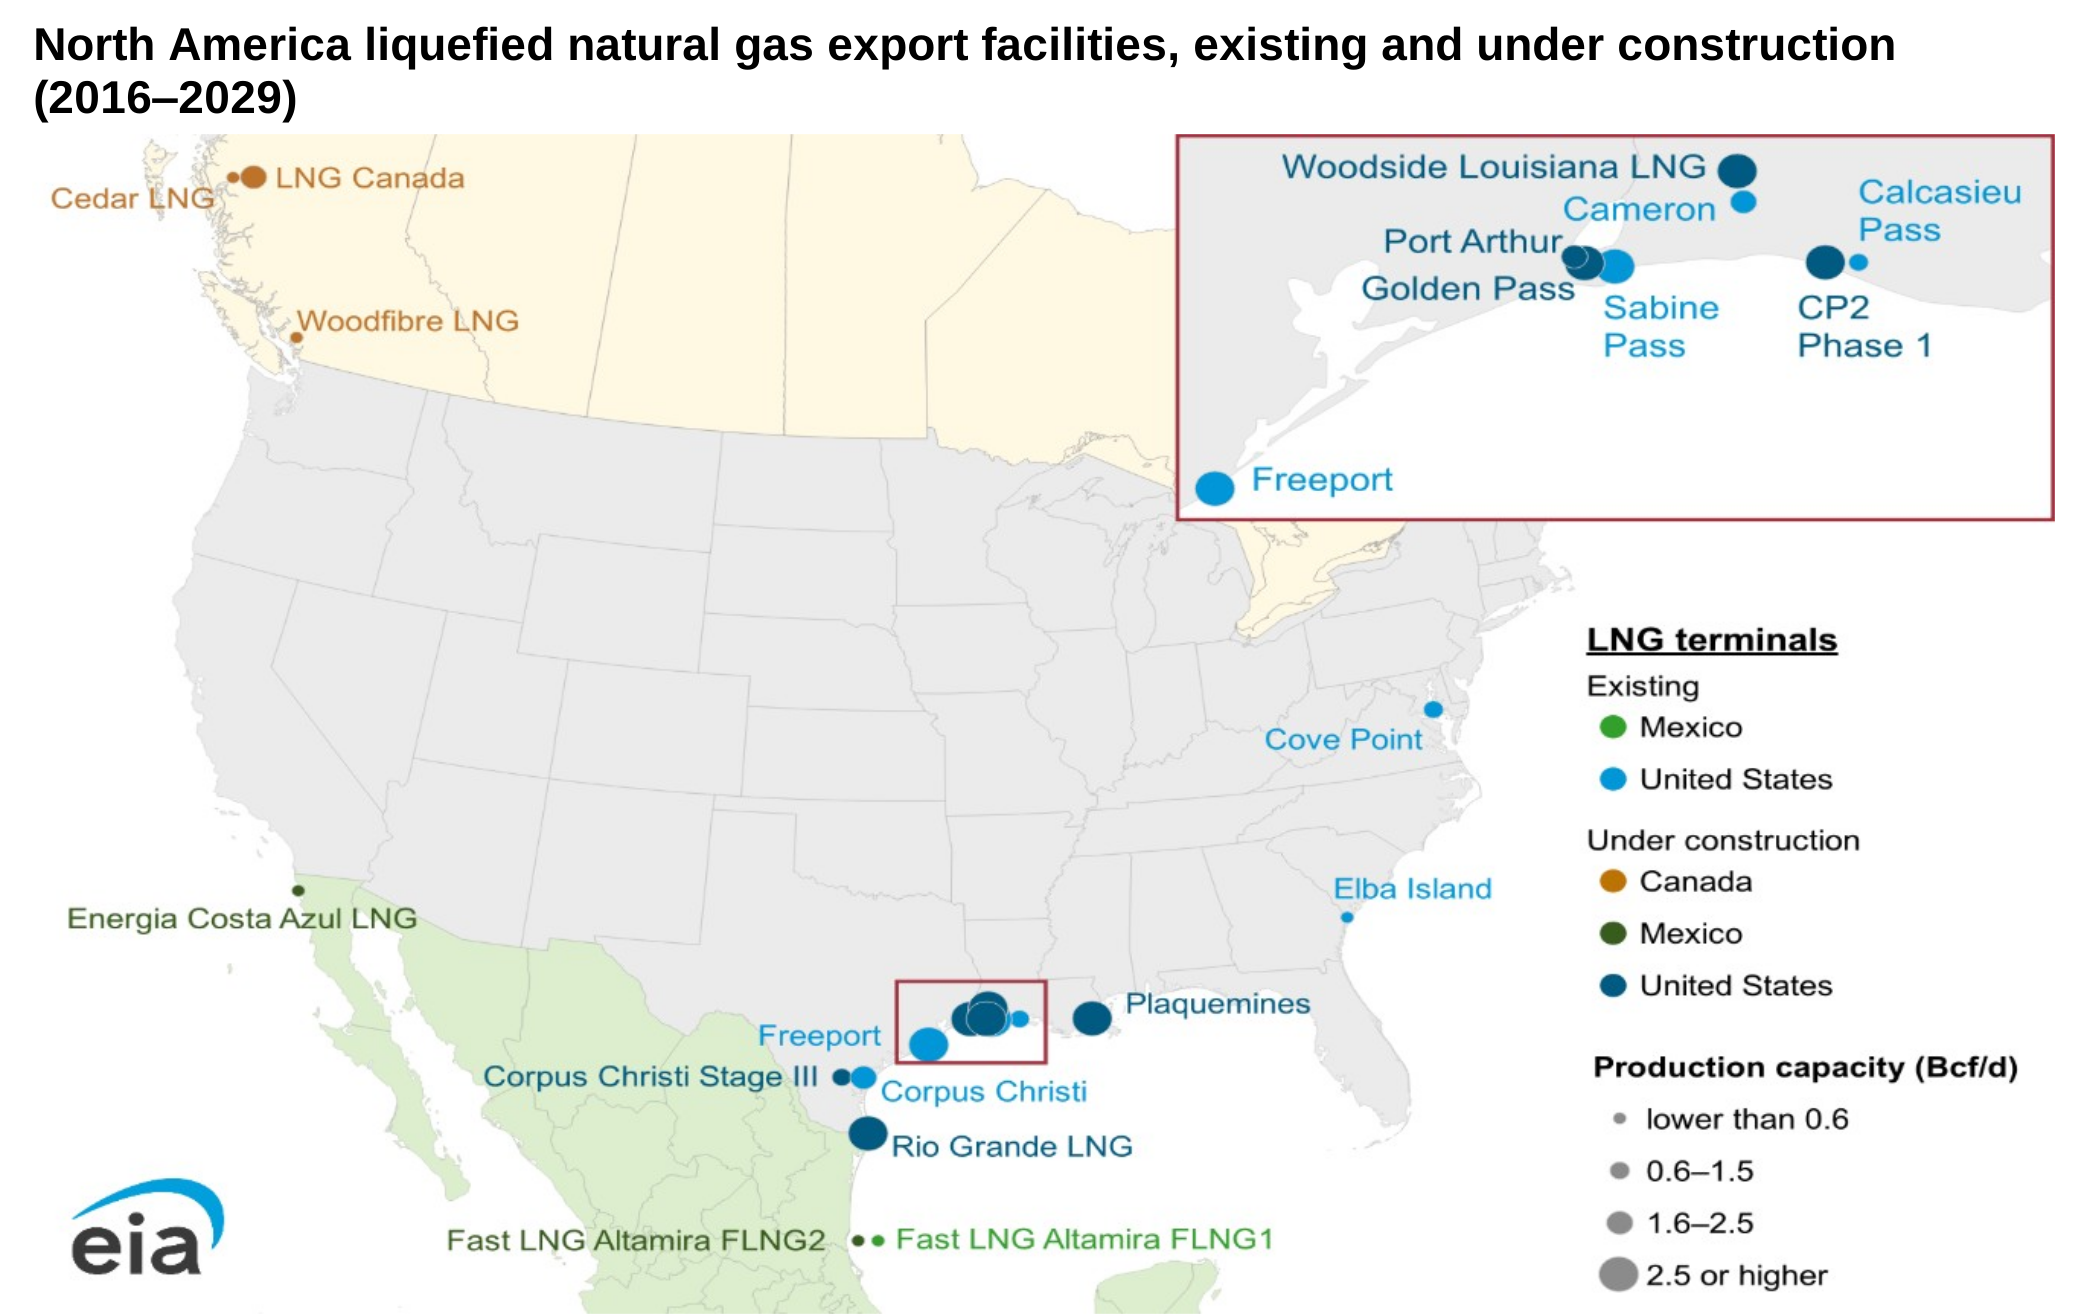
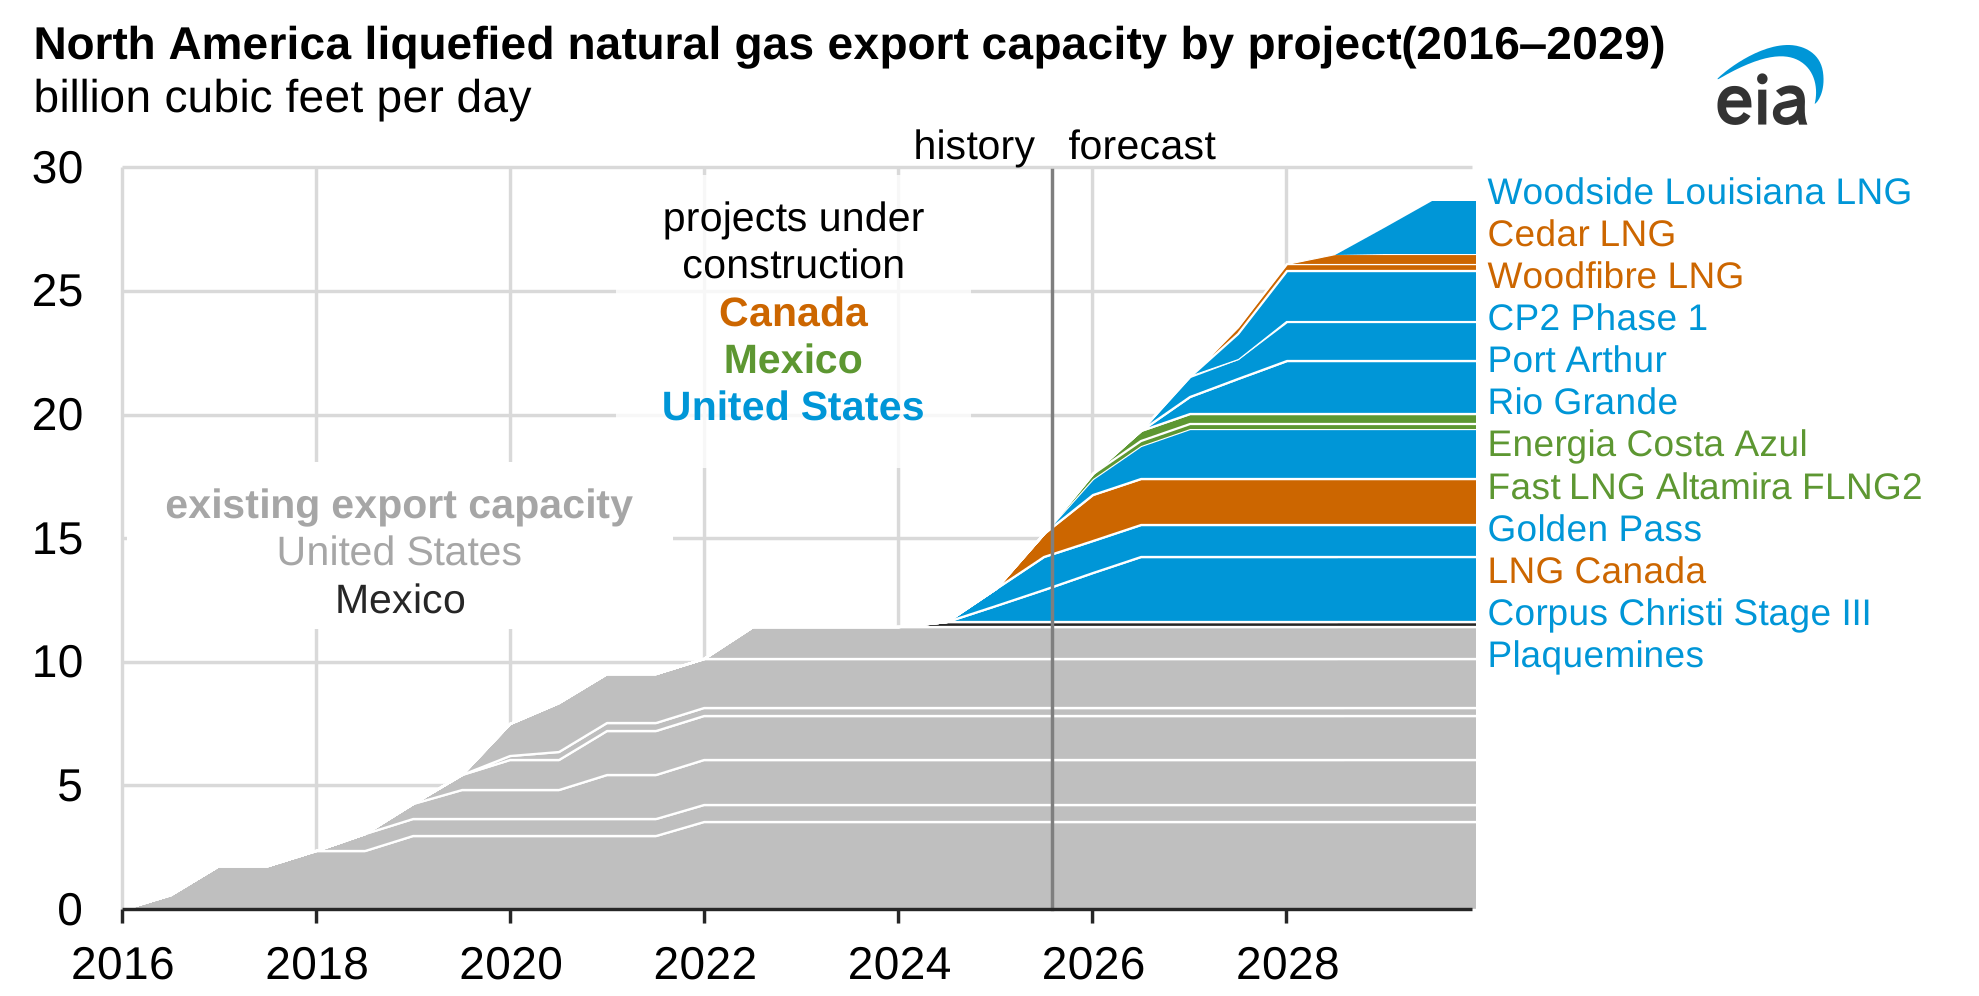
Behind the operating fleet is a large queue of projects that were under construction or had taken final investment decision by early 2025. If all proceed on their announced schedules, US LNG export capacity could exceed 25 Bcf per day by 2030, equivalent to roughly one-quarter of total US natural gas production. The projects in this second wave are dominated by four sponsors: Venture Global, Cheniere, Sempra and NextDecade.
Table 24-2: US LNG projects under construction and proposed
| Project | Location | Sponsor | Capacity (MTPA) | Status | Target First Cargo |
|---|---|---|---|---|---|
| Rio Grande LNG (Phase 1) | Brownsville, Texas | NextDecade | 17.6 | Under construction | 2027 |
| Port Arthur LNG (Phase 1) | Port Arthur, Texas | Sempra | 13.5 | Under construction | 2027 |
| Golden Pass | Sabine Pass, Texas | ExxonMobil and QatarEnergy | 18.1 | Commissioning | 2025 or 2026 |
| CP2 LNG | Cameron Parish, Louisiana | Venture Global | 20.0 (phase 1) | FID 2025 | 2028 |
| Magnolia LNG | Lake Charles, Louisiana | Glenfarne | 8.8 | Approved, pre-FID | 2029 |
| Commonwealth LNG | Cameron Parish, Louisiana | Commonwealth | 9.5 | Approved, pre-FID | 2029 |
| Delfin LNG (floating) | Offshore Louisiana | Delfin Midstream | 13.2 | Approved, pre-FID | 2028 |
The Biden Pause and the Trump Reversal
On January 26, 2024, the Department of Energy announced a pause on pending decisions on LNG export applications to non-free-trade-agreement countries, which cover almost every large importing market outside Korea and a handful of others. The stated reason was to allow DOE to update its underlying economic, environmental and national-security analysis of LNG exports, which had not been materially revised since 2018. Projects without an existing non-FTA export authorization, including CP2, Commonwealth, Magnolia and several others, were left in regulatory limbo. Cheniere, Sempra and Venture Global could still ship cargoes under existing authorizations, and new offtake contracts for unapproved projects effectively froze.
In July 2024, a federal district court in Louisiana issued a preliminary injunction against the pause in a challenge brought by sixteen state attorneys general, finding plaintiffs likely to succeed on claims that DOE had acted arbitrarily under the Administrative Procedure Act. The pause remained in effect as a matter of DOE policy while the case was appealed. On January 20, 2025, his first day back in office, President Trump signed an executive order directing DOE to lift the pause and resume processing of pending non-FTA applications. DOE began issuing approvals in the first quarter of 2025, and Venture Global took final investment decision on CP2 shortly afterward.
Where the Cargoes Go
US LNG is sold on flexible terms that allow cargoes to be redirected to whichever market offers the highest netback, and the destination mix has flipped in five years. In 2019, the year the second and third waves of US liquefaction trains came online, the largest buyers were in Asia. Korea, Japan and China together took close to half of every US cargo. By 2024, after the loss of Russian pipeline gas to Europe, the picture had inverted: Europe took more than half of US LNG, with the Netherlands, France and the United Kingdom as the top three importing countries.
Figure 24-6: US LNG Export Destinations: 2019 vs 2024
Henry Hub, TTF and JKM
Global natural gas is priced against three regional benchmarks. Henry Hub, at the Erath, Louisiana pipeline nexus, is the US physical and futures benchmark. TTF, the Title Transfer Facility in the Netherlands, is the European benchmark used for both physical trades and the ICE futures contract. JKM, the Japan Korea Marker published by S&P Global Platts, is the Asian spot LNG benchmark. In a fully globalized market, TTF and JKM should settle close to Henry Hub plus liquefaction fees and freight. In practice they settle wherever physical shortage puts them, and the arbitrage is what pulls US LNG cargoes back and forth across oceans.
Table 24-3: Global gas benchmarks and 2024 averages
| Benchmark | Location | Role | 2024 Average (USD per MMBtu) |
|---|---|---|---|
| Henry Hub | Erath, Louisiana | US pipeline and futures benchmark | 2.19 |
| TTF | Netherlands virtual hub | European pipeline and futures benchmark | 10.80 |
| JKM | Japan and Korea delivered | Asian spot LNG benchmark | 11.80 |
Figure 24-7: Global Gas Benchmarks ($/MMBtu), 2018 to 2025
Sources: World Bank Commodity Prices, ICE, CME (illustrative annual averages)
The spread between Henry Hub and the two international markers is what makes a US LNG cargo profitable once variable shipping and boil-off are taken into account. A cargo loaded at Sabine Pass in mid-2024 bought feed gas at roughly 2.20, paid a liquefaction tolling fee of 2.50 to 3.50 per MMBtu depending on the contract, added shipping of roughly 0.70 to Rotterdam or 1.20 to Tokyo, and could resell at TTF or JKM levels well above 10. The arbitrage does not always close. When TTF fell back to a 6 dollar handle in the summer of 2024 the economics for cargo diversion compressed sharply, and some uncommitted tolling capacity was left unused. When international prices spike, as they did in the summer of 2022 when TTF briefly traded above 70 dollars per MMBtu equivalent, the pull on US feed gas is intense enough to move Henry Hub itself.
LNG Pricing Contracts
US LNG is sold in two basic contract shapes. The first is a Sale and Purchase Agreement where the seller takes price risk on both legs: the buyer pays a delivered price linked to Henry Hub or, for some Asian buyers, to a Brent-based formula often containing an S-curve that dampens price changes at the extremes. The second is a tolling agreement, which is the Cheniere model. Here the buyer supplies its own feed gas at Henry Hub and pays Cheniere a liquefaction fee of roughly 2.25 to 3.50 per MMBtu regardless of whether the buyer lifts the cargo. The tolling structure shifts commodity risk to the buyer and leaves the liquefaction operator with a utility-like revenue profile, which is what allowed Cheniere to finance Sabine Pass in the capital markets.
Destination flexibility and diversion clauses are almost universal in US contracts. This is the single biggest commercial difference between US LNG and the older Qatari and Australian long-term contracts, which frequently restricted where cargoes could land. When TTF is above JKM, a US cargo bound for Asia can be diverted to Rotterdam with a shared profit split between the offtaker and the liquefier. Destination flexibility is what made US LNG the swing supplier to Europe in 2022, and it is why European buyers have been willing to sign twenty-year offtake contracts with second-wave projects.
Who Captures the Spread
Set Henry Hub near 3 dollars against a TTF or JKM above 20 and the natural question is whether the chain in between really costs 17 dollars to run. It does not. Feed gas, a liquefaction fee of 2.25 to 3.50, shipping of 0.70 to 1.20 and boil-off come to something in the region of 4 to 5 dollars over the Henry Hub price. Everything above that is scarcity rent rather than cost, created by shortage at the delivered end, and the question that follows is who collects it.
Not the liquefaction company, in most cases, because it sold that claim deliberately. A tolling operator collects its fee whether the cargo lifts or not, and collects the same fee when TTF is 6 dollars as when TTF is 70. That was the trade it made to finance the plant: a utility-like return in exchange for the upside. Not US gas producers either, or not much of it, because Henry Hub is set in a continental market where LNG feed gas is roughly 14 percent of production, against a shale supply base that answers a price signal within a year. Exports lift Henry Hub, and the speed of the shale response caps how far.
What is left accrues to whoever holds the tolling capacity and the right to choose the destination, which means the portfolio players and the utilities that signed offtake contracts years earlier. It is less of a windfall than any single year makes it look, because the same contract obliges them to pay the fee in the years the arbitrage is shut, as it was in the summer of 2024 when TTF fell to a 6 dollar handle and uncommitted capacity went unused. Averaged over a twenty-year contract, the spread in a crisis year is the payoff on premiums paid in the slack ones.
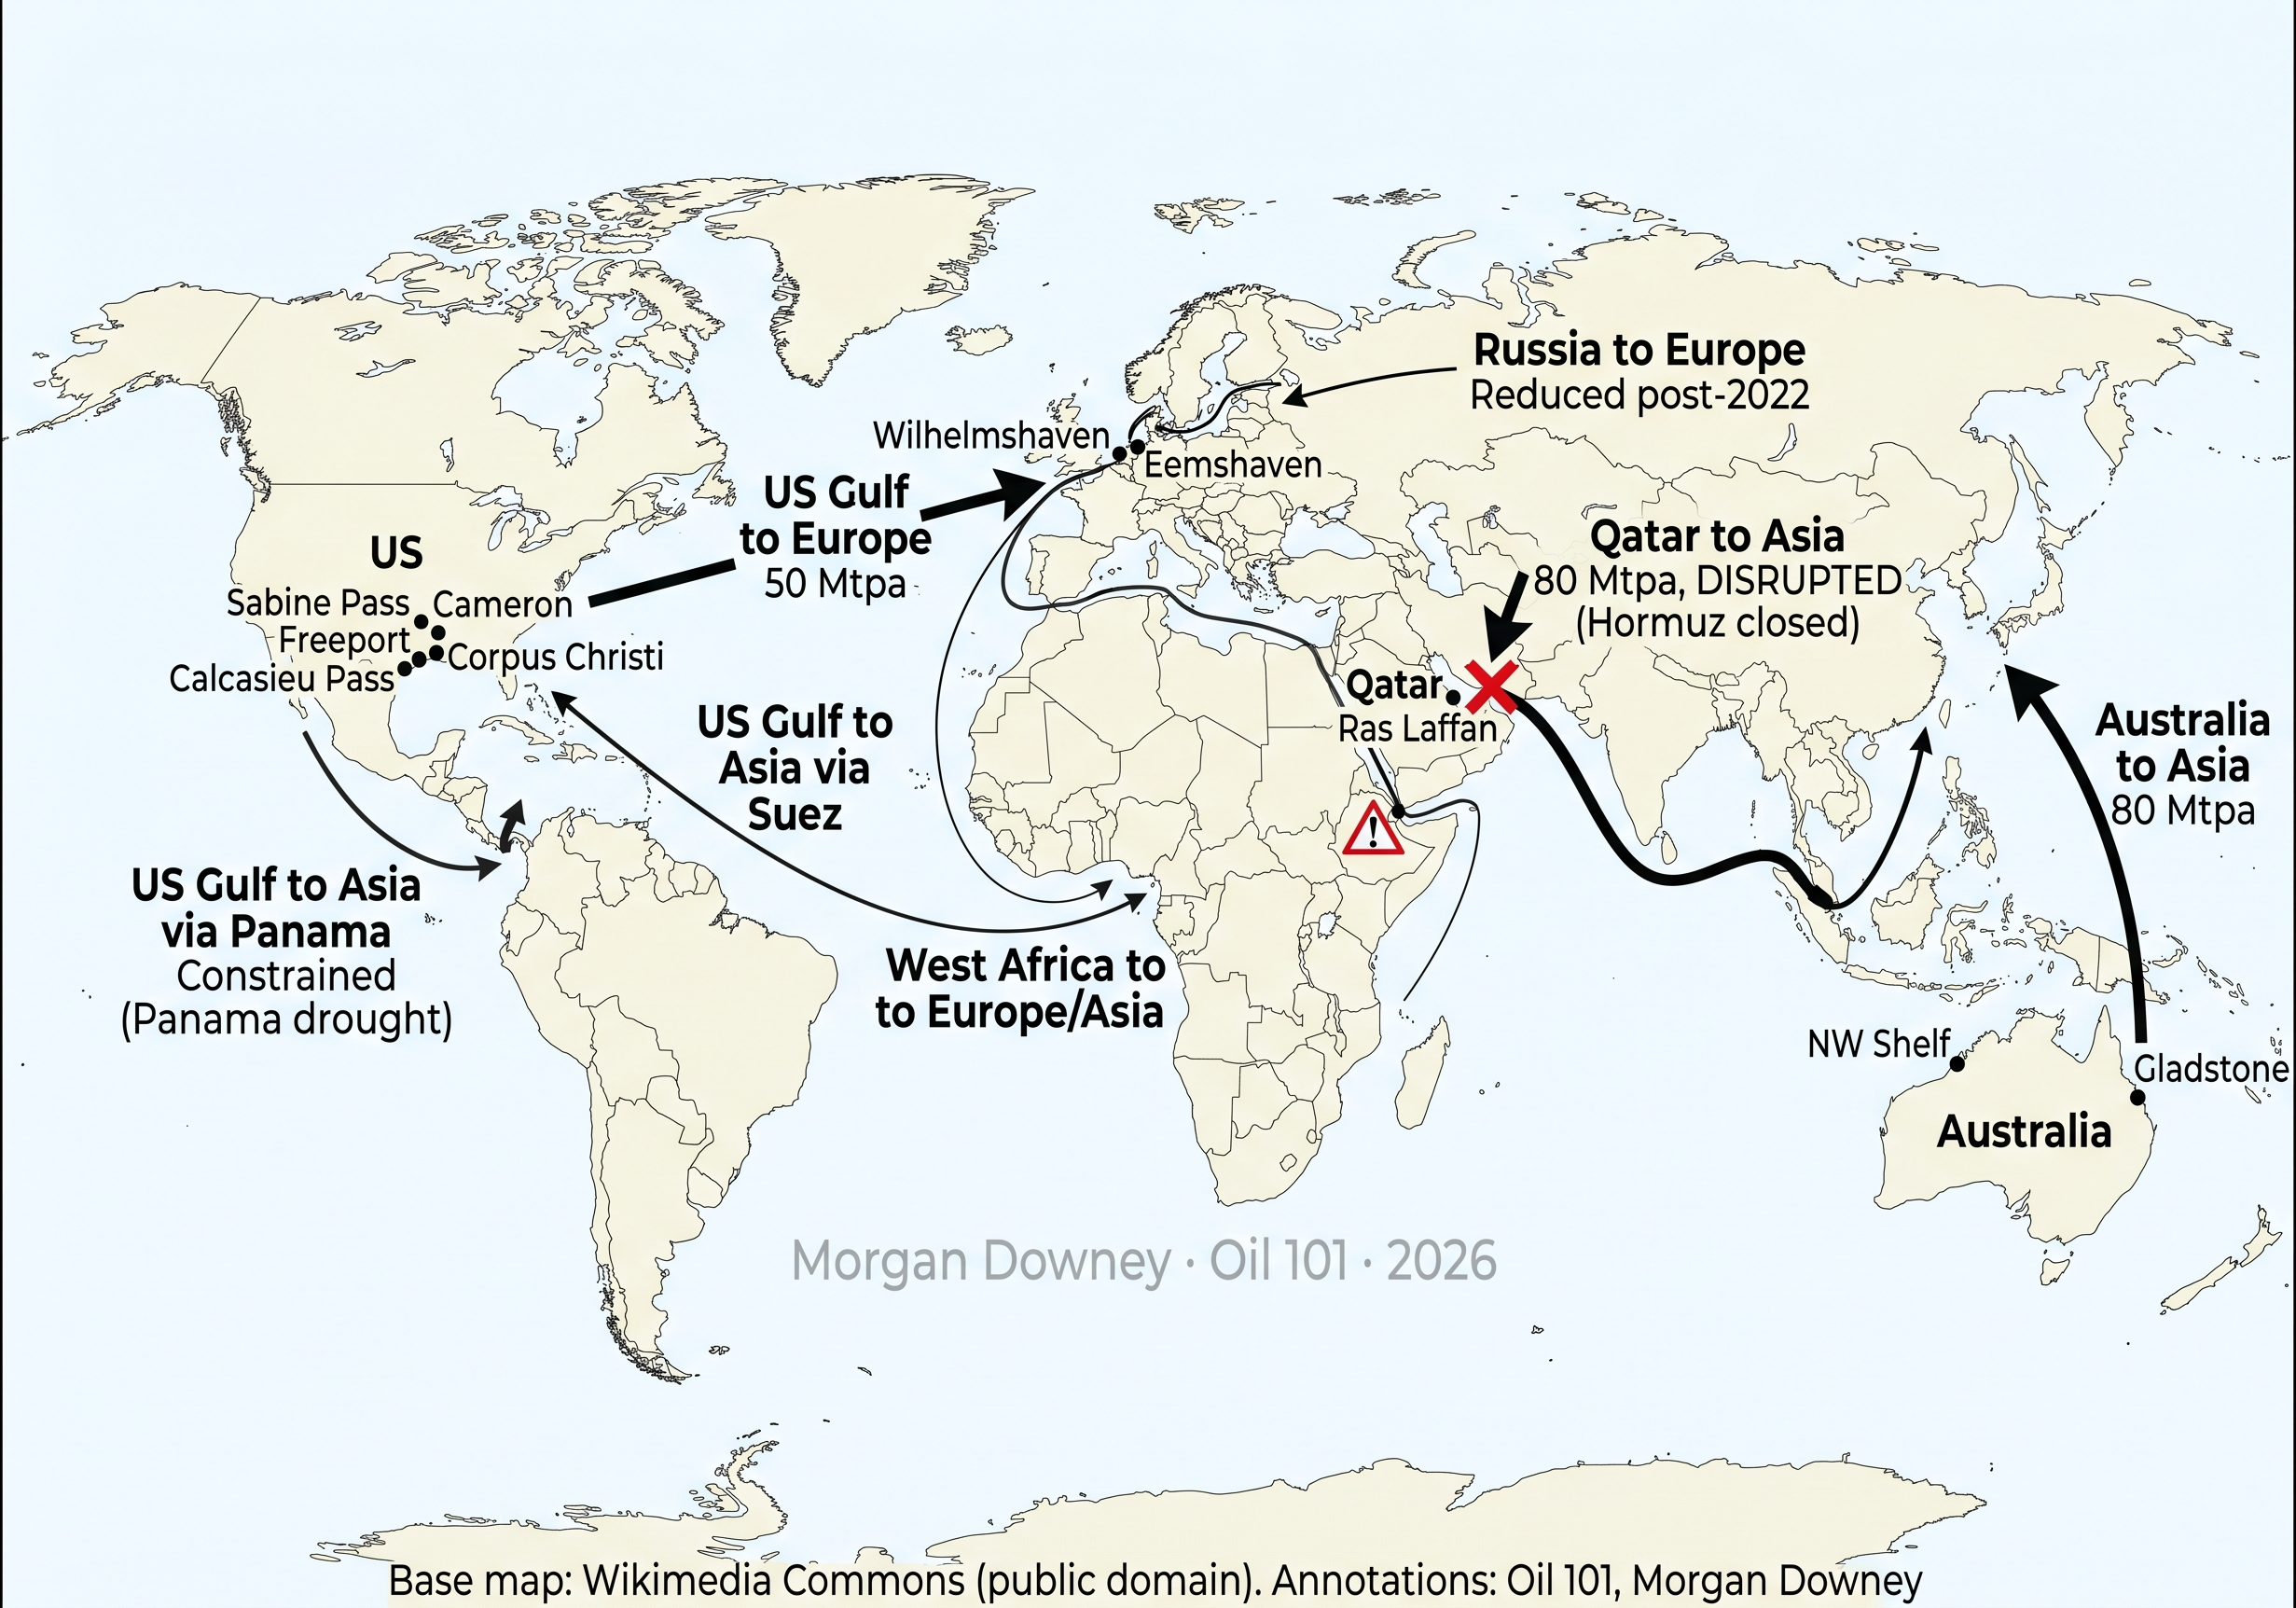
Arbitrage does not close the gap quickly because the response is a construction project rather than a trade. Liquefaction runs roughly four to five years from final investment decision to first cargo, and the capacity being built now was committed against a view of the 2030s rather than against this winter's price. The capacity already built is sold forward, so a high TTF does not call forth an extra cargo this year, it changes who profits from the cargoes that were already going to load. The 2026 disruption to Qatari exports made the point from the other direction: European and Asian buyers holding QatarEnergy force majeure notices could not be supplied any faster by American gas at 3 dollars, because the constraint was ships and trains rather than molecules or price. Chapter 26 covers that disruption.
LNG Carriers
LNG is moved in purpose-built, double-hulled carriers with insulated cargo tanks that hold liquefied gas at roughly minus 162 degrees Celsius. Four basic size classes are in service today.
Table 24-4: LNG carrier classes
| Class | Capacity (m3) | Bcf-equivalent per voyage | Notable routes | Prime operators |
|---|---|---|---|---|
| Conventional | 138,000 to 145,000 | 3.0 to 3.1 | Legacy Pacific and Mediterranean routes | MOL, NYK, K-Line |
| TFDE / DFDE membrane | 170,000 to 180,000 | 3.6 to 3.8 | US Gulf Coast to Rotterdam, Zeebrugge, Tokyo | GasLog, Maran Gas, Teekay, Mitsui OSK |
| Q-Flex | 210,000 to 217,000 | 4.5 | Ras Laffan to Asia and northwest Europe | Nakilat (Qatar), Shell-chartered |
| Q-Max | 263,000 to 266,000 | 5.5 to 5.6 | Ras Laffan to South Hook and Zeebrugge | Nakilat (Qatar) |
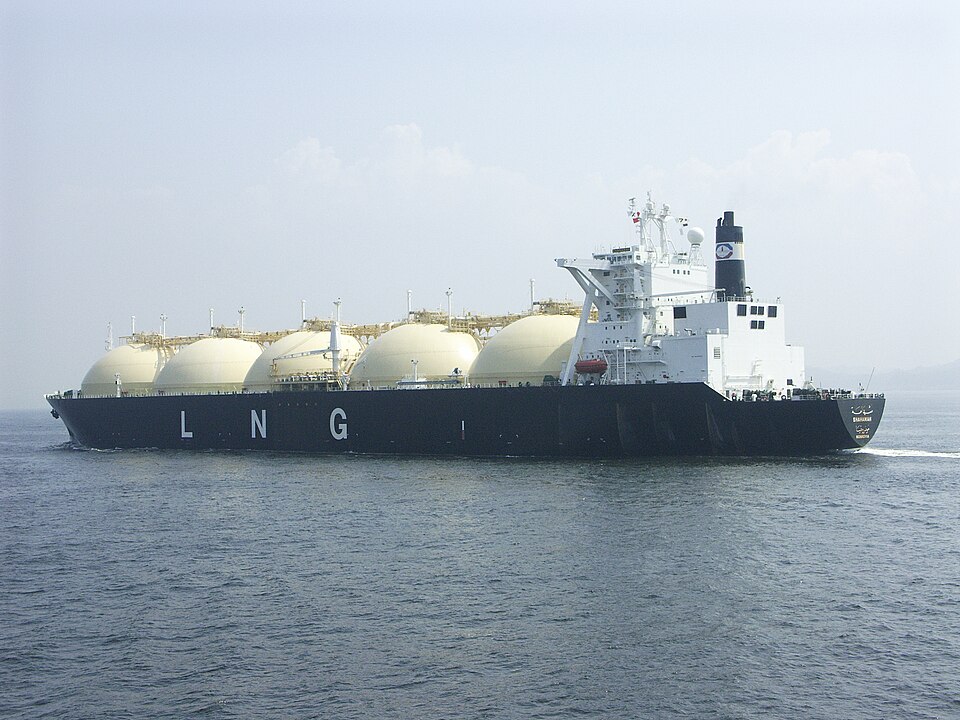
The modern workhorse is the 174,000 cubic metre membrane carrier with tri-fuel diesel-electric or, increasingly, two-stroke dual-fuel propulsion. This is the vessel that loads at Sabine Pass or Calcasieu Pass and delivers into Europe or Asia. The much larger Q-Max and Q-Flex classes were built specifically for the Qatari fleet and for the few terminals, chiefly South Hook in Wales and the Adriatic LNG terminal offshore Italy, that can physically accommodate them.
Shipping Bottlenecks: Panama and the Red Sea
US LNG cargoes bound for Asia have two natural routes. The shorter one runs through the Panama Canal, whose neo-Panamax locks opened in 2016 and can accommodate LNG carriers up to roughly 180,000 cubic metres, which is the modern membrane workhorse. The longer route runs through the Suez Canal and across the Indian Ocean, and historically through the Red Sea and Bab-el-Mandeb. A third option, around the Cape of Good Hope, adds roughly fifteen days of steaming time each way relative to Suez.
Both of the short routes were disrupted in 2023 and 2024. A severe drought in Gatun Lake in 2023 forced the Panama Canal Authority to cut daily transit slots and to auction the remaining slots at extraordinary prices, driving most LNG carriers onto longer routes. Separately, Houthi missile and drone attacks on shipping in the southern Red Sea starting in December 2023 forced most LNG carriers to abandon the Suez route entirely and reroute around southern Africa, lengthening voyage times by roughly two weeks. The combination of Panama drought and Red Sea disruption tightened global LNG shipping capacity and widened the basis between Europe and Asia, because Asian buyers were effectively farther from US Gulf Coast loading docks than they had been for the previous decade.
FSRUs and Europe's 2022 Scramble
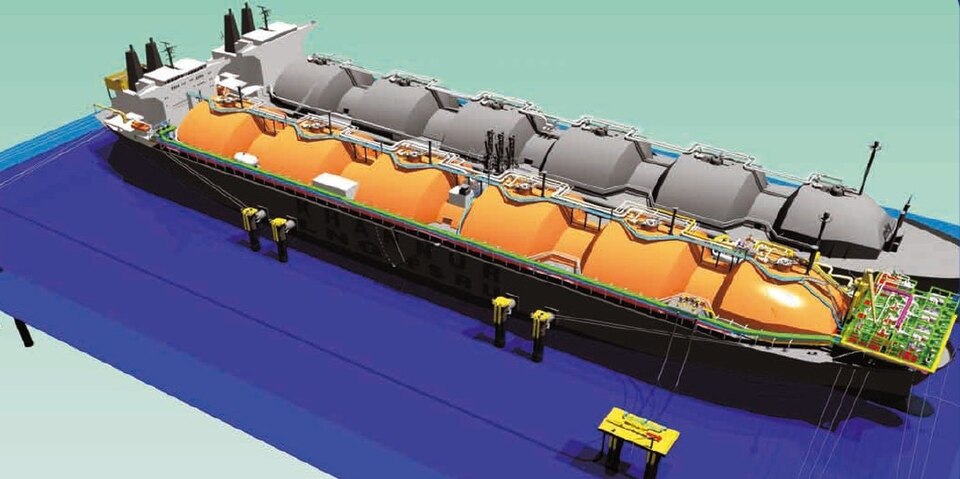
On the import side, the most visible piece of new infrastructure since Russia's 2022 invasion of Ukraine has been the floating storage and regasification unit. An FSRU is an LNG carrier with regasification equipment mounted on deck: it takes delivery of a cargo, warms the liquid back to vapour, and pipes it into the local grid through a jetty or buoy. FSRUs can be commissioned in twelve to eighteen months, against five to seven years for an onshore terminal, which is why they were the tool of choice in Europe's scramble to replace Russian pipeline gas.
Germany, which had no LNG import capacity at all before 2022, commissioned five FSRUs within roughly ten months of the invasion. Wilhelmshaven 1 hosted the Höegh Esperanza and sent first gas into the German grid on December 22, 2022. Brunsbüttel followed with the Höegh Gannet in January 2023. Lubmin, near the old Nord Stream landfall, took a smaller Excelerate unit. A second Wilhelmshaven berth and a second Brunsbüttel berth came later in 2023. Beyond Germany, the Netherlands brought the Eemshaven FSRU online in September 2022, Italy commissioned an FSRU at Piombino in 2023 after reversing a long political fight, and Finland brought the Exemplar into the port of Inkoo on the Gulf of Finland to serve the Finnish and Baltic grids after the end of Russian pipeline flows.
Henry Hub Globalization
The cumulative effect of the US LNG buildout, the Ukraine war and the flexibility of American contracts is that Henry Hub is no longer a purely domestic benchmark. When European TTF or Asian JKM rise materially above Henry Hub plus tolling and shipping, US liquefaction plants run full, feed-gas pipelines pull harder on Haynesville and Permian supply, and Henry Hub prices themselves drift up. When international prices fall, some uncommitted cargoes are cancelled, although tolling fees are still paid under take-or-pay terms, and the pull on US domestic gas eases. In both directions the US pipeline grid is now coupled to global gas via a 14 Bcf per day export valve that did not exist a decade ago.
For US gas producers, the old hedging rules no longer suffice. Henry Hub is increasingly influenced by European winters, Asian summers, typhoon season in the East China Sea, and geopolitical events thousands of miles from Louisiana and Texas. Producers now hedge with forward curves, basis swaps to regional hubs like Waha and Dominion South, and, for the more sophisticated, cross-commodity structures against TTF or JKM through the futures and over-the-counter markets described in Chapter 18 (Futures and Swaps).
US LNG has connected the American gas market to the world. What was once a stranded, landlocked commodity is now a globally traded energy source with geopolitical weight rivalling crude oil. Implications for US producers, European utilities, Asian buyers and US policymakers are still playing out, and the second wave of liquefaction capacity will reset those relationships again before the decade is out.