Chapter 12
Storage
Oil storage explained: tank farms, salt caverns, floating storage, the Cushing hub, and strategic petroleum reserves worldwide.
Why Store Oil?
Oil moves continuously from wellhead to burner tip, but production, shipping, refining, and consumption never match minute by minute. Storage is the shock absorber. Every barrel of crude or product sits in a tank, cavern, pipeline, or ship at some point between reservoir and consumer, and the scale is large: the world holds several billion barrels of petroleum in commercial and strategic stocks at any moment.
There are three motivations for holding oil, and mixing them up is a common source of confusion in market commentary:
- Operational. Refineries, terminals, and pipelines need tankage to buffer day to day mismatches between inbound and outbound flows. A refinery receiving crude on a weekly VLCC schedule but running the plant 24 hours a day must hold at least a week of throughput on site. This inventory is not speculative; it is the grease that keeps the machinery moving.
- Strategic. Governments hold reserves against supply disruption. The US Strategic Petroleum Reserve, the EU national stocks, and Japan's JOGMEC holdings exist because a 1970s style embargo or a modern Strait of Hormuz closure could strand consumers for weeks. Member countries of the International Energy Agency commit to holding 90 days of net imports as a condition of membership.
- Commercial and speculative. Traders store oil when the forward curve is in steep enough contango that buying spot and selling forward locks in a profit after paying storage, insurance, financing, and shrinkage. This is the cash and carry trade, and it is how the futures market disciplines physical inventories.
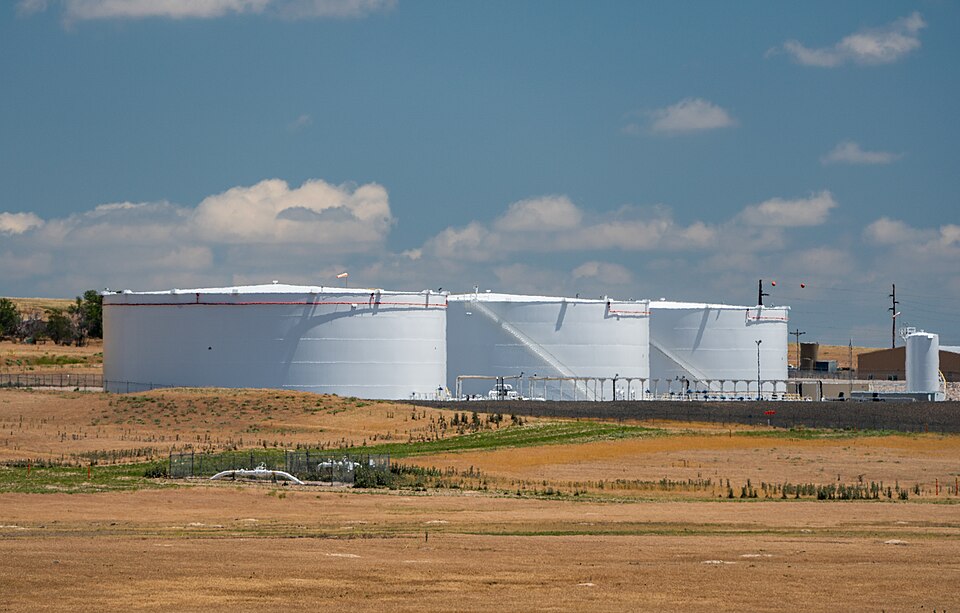
Categories of Storage
Oil inventory lives in several physically distinct settings, each with its own cost structure, turnover rate, and regulatory treatment. The table below walks through the main categories in roughly increasing order of how long a barrel tends to sit in each.
Table 12-1: Categories of Oil Storage
| Type | Typical Scale | Primary Use |
|---|---|---|
| Refinery operating tankage | 5 to 20 days of crude runs plus product day tanks | Buffer between crude deliveries, runs, and product lifting |
| Terminal and midstream tankage | Tens to hundreds of thousands of barrels per tank | Third-party storage for traders, blenders, marketers |
| Pipeline fill (line pack) | Several hundred MMbbl in the US system | Oil in motion that must remain in the line at all times |
| Tank farm hubs | Cushing, Midland, Houston, ARA (Rotterdam), Singapore, Fujairah | Price discovery and delivery points for benchmark futures |
| Salt caverns | 1 to 10+ MMbbl per cavern | Cheap bulk storage of crude, NGLs, and natural gas |
| Floating storage | 2 MMbbl per VLCC | Contango plays, logistics timing, sanctioned trade |
| Strategic reserves | Hundreds of MMbbl (SPR: 714 MMbbl design) | National security, IEA 90-day obligation |
Line pack is the least intuitive of these. A long-haul crude pipeline like Keystone or Enbridge Mainline holds millions of barrels simply because it is full of oil from origin to terminus at all times. That volume never appears in a tank farm report, but it is real inventory, and it cannot be withdrawn without shutting the line down.
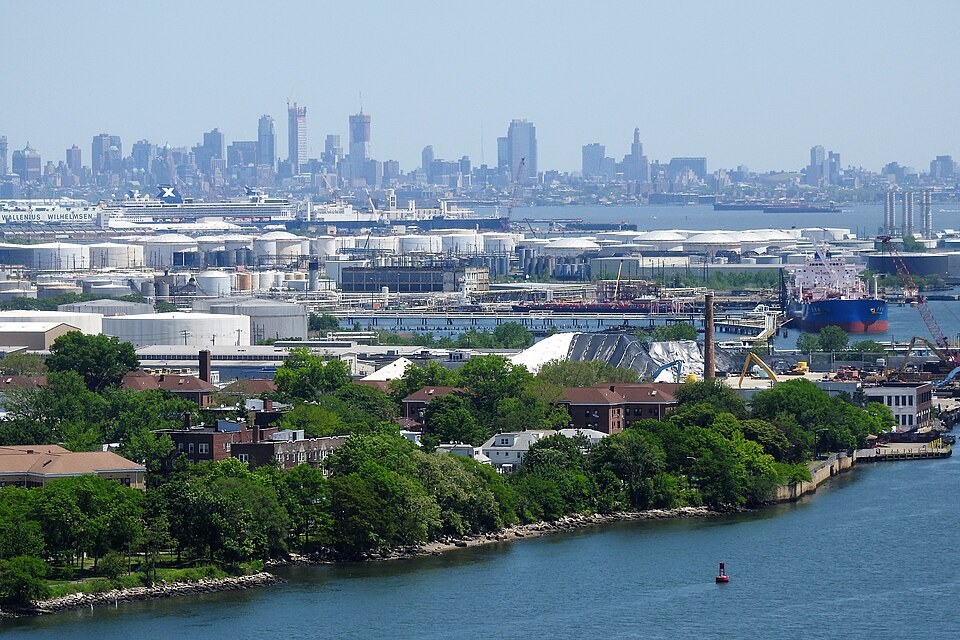
Tank Types
Walk any tank farm and you see a handful of recurring shapes. Each exists because the physical properties of the stored product, vapor pressure above all, demand a specific containment design. A fixed roof tank holding gasoline would lose a meaningful fraction of its contents to evaporation every week; a spheroid holding crude would be a grotesque waste of steel.
Table 12-2: Above-Ground Tank Typology
| Type | Typical Product | Typical Size | Reason for Design |
|---|---|---|---|
| Fixed (cone) roof | Heavy fuel oil, asphalt, water | Up to 500,000 bbl | Cheapest design; vapor space above liquid accepts breathing losses |
| External floating roof | Crude oil, gasoline, naphtha | Up to 1,500,000 bbl | Roof floats directly on product, sealed to wall, kills evaporation |
| Internal floating roof | Gasoline, jet, light distillates | Up to 500,000 bbl | Fixed dome over internal deck; rain and snow excluded, vapor still captured |
| Dome roof | LPG, light naphtha | Up to 100,000 bbl | Gas-tight geodesic or welded dome for low-pressure volatile liquids |
| Horizontal bullet | Propane, butane | 10,000 to 60,000 gallons | Small pressure vessel for local distribution and retail sites |
| Horton sphere | LPG, NGLs, ethylene, light ends | 10,000 to 80,000 bbl | Sphere minimizes surface area per volume under pressure |
| Cryogenic full-containment | LNG, ethylene, propylene | Up to 1 MMbbl LNG equivalent | Inner 9% nickel-steel tank, outer prestressed concrete shell, annulus packed with expanded perlite |
Figure 12-3: Above-Ground Tank Typology
Ordered by the vapour pressure of the contents
Every tank, regardless of type, has a dead stock or heel: a physical residual at the bottom that cannot be pumped without sucking air. Dead stock is part of the capital asset rather than working inventory, and it is excluded from the "working capacity" figures the industry quotes. When a tank farm is reported as 95 percent full, the denominator is working capacity, not shell capacity.
Cushing, Oklahoma: The Pipeline Crossroads
Cushing began as a pipeline junction in the 1910s, when the Glenn Pool field to its south made central Oklahoma one of the largest oil regions on earth. A century later the wells are mostly gone but the pipelines remain, and Cushing sits at the intersection of crude flowing in from the Bakken, Permian, Western Canada, and the Gulf Coast. When NYMEX launched its WTI light sweet crude contract in 1983, it designated Cushing as the physical delivery point. That choice turned an Oklahoma tank town into the most closely watched piece of real estate in global oil.
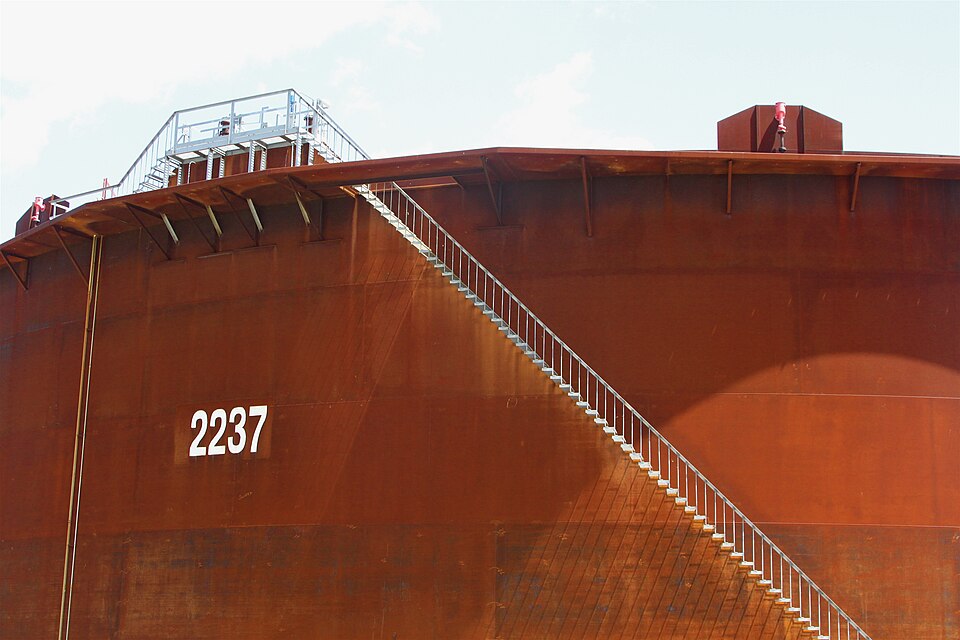
Working capacity at Cushing has grown with every contango cycle. The hub held under 50 million barrels in 2004, crossed 80 million during the 2008-2009 contango build, and tops out near 95 million barrels today, spread across roughly a dozen terminal operators. The largest names are Enbridge, Enterprise, Magellan (now part of Oneok), Plains, Blueknight, and SemGroup. Physical delivery against the expiring futures contract is handled by pipeline and in-tank transfers between these operators.
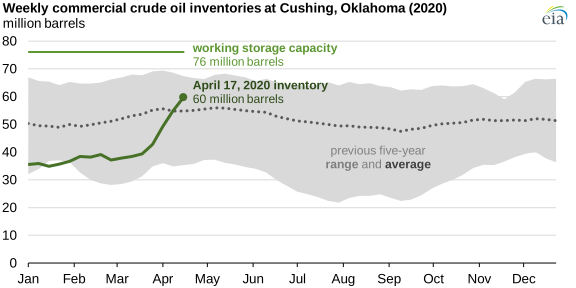
Cushing is landlocked and cannot export to tidewater directly. When inflows from the Permian and Canada exceed outflows to Gulf Coast refiners, inventories build and WTI weakens against Brent and against its own forward months. The extreme case was April 2020, when Cushing approached operational full and traders holding expiring WTI contracts had nowhere to take delivery. The May 2020 contract settled at minus $37.63 per barrel, the first negative print in the history of the benchmark. Chapter 23 (Negative Prices) walks through that event in detail.
Figure 12-5: Cushing, Oklahoma Crude Inventory (2015 to 2025)
Source: EIA Weekly Petroleum Status Report (illustrative monthly snapshots). Shaded band shows 5-year range.
Salt Caverns
Salt is almost uniquely suited to storing hydrocarbons. It is impermeable to oil and gas, does not react with them, and under pressure creeps plastically, so small fractures heal themselves rather than propagating. Salt only dissolves in water, and hydrocarbons are immiscible with water, so a salt cavern filled with crude will hold that crude indefinitely with essentially no loss.
Caverns are created by solution mining. A well is drilled into a salt dome or bedded salt formation, fresh water is injected, the dissolved brine is produced back to surface, and over months to years the cavity grows into the desired shape. A single cavern can hold 5 to 10 million barrels and cost roughly one tenth what the same capacity in steel above-ground tankage would cost. Injection and withdrawal are done by displacement: to pull oil out, operators pump brine in at the bottom; to store more, they pump oil in and brine out.
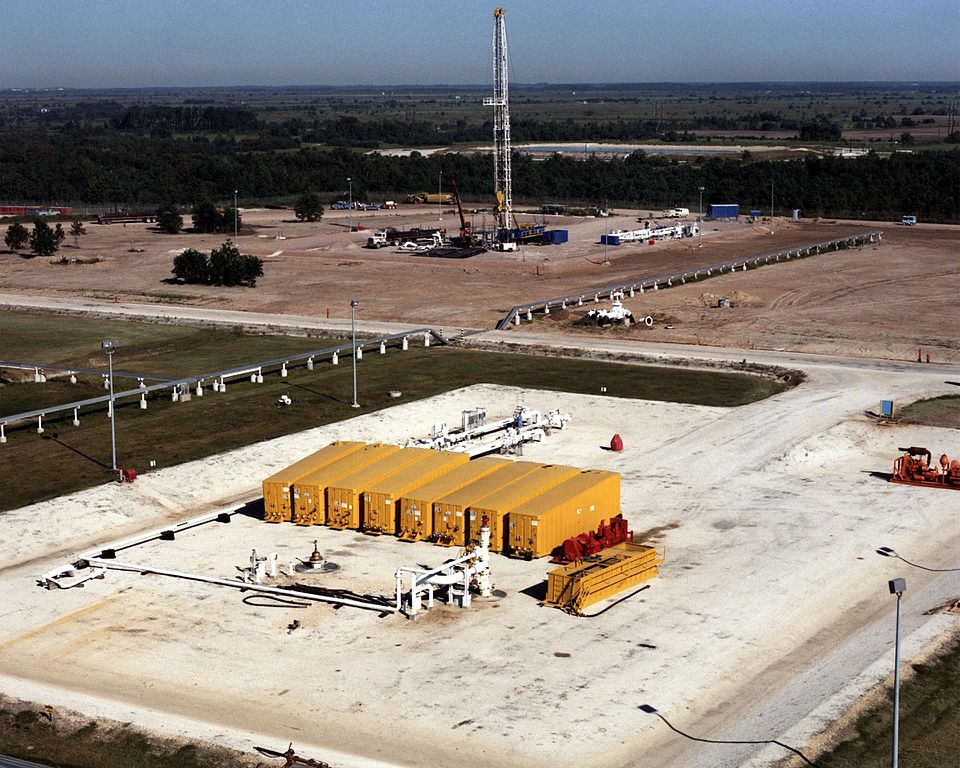
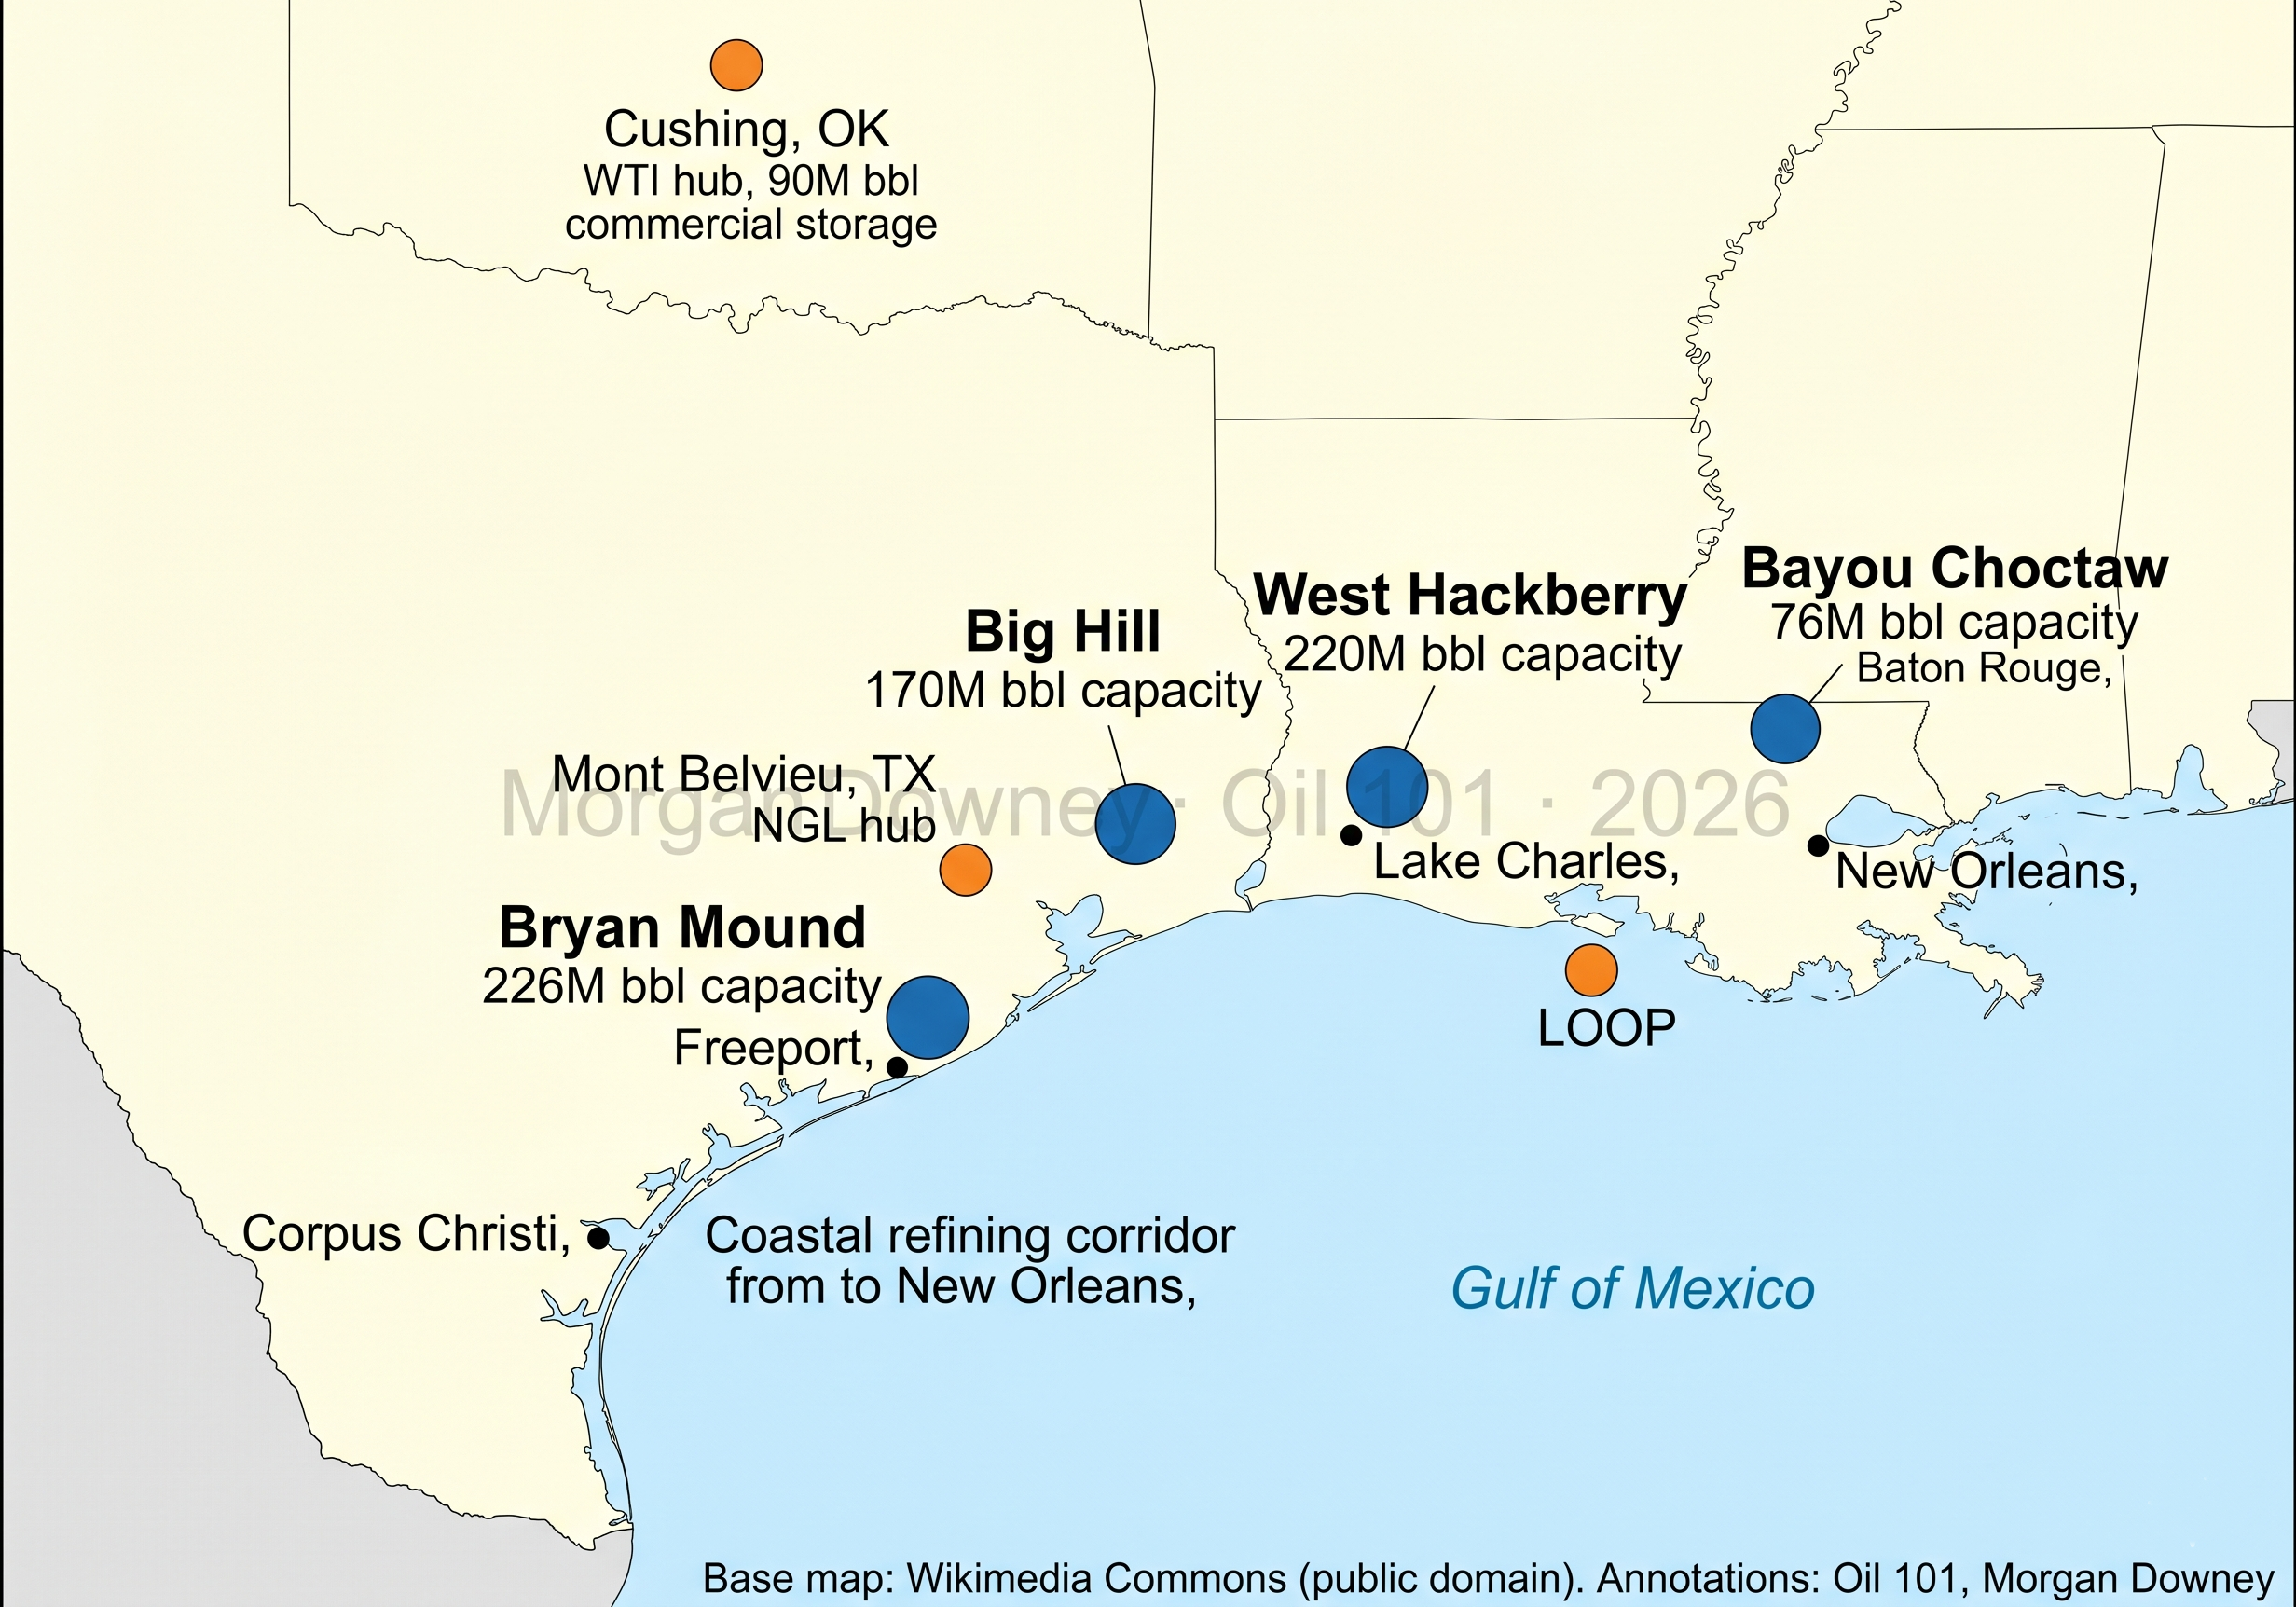
The largest cavern complex in the world is Mont Belvieu, Texas, on the upper Gulf Coast, which stores the NGL barrel of the United States: ethane, propane, normal butane, isobutane, and natural gasoline, in hundreds of caverns holding several hundred million barrels in aggregate. Conway, Kansas plays a similar but smaller role for the mid-continent. Petal, Mississippi stores natural gas and NGLs for the southeastern pipeline grid. And the US Strategic Petroleum Reserve uses four salt dome sites along the Texas and Louisiana coast: Bryan Mound and Big Hill in Texas, West Hackberry and Bayou Choctaw in Louisiana.
The US Strategic Petroleum Reserve
Congress created the SPR in 1975, two years after the Arab oil embargo had shown American drivers what a supply shock looked like. The reserve's design capacity is 714 million barrels spread across the four Gulf Coast salt dome complexes, making it the largest government-owned emergency stockpile on earth. Sustained drawdown capacity is about 4.4 million barrels per day, enough to replace meaningful import losses, and oil can begin reaching the market within about 13 days of a presidential drawdown order.
SPR levels rebuilt slowly after the 2022-2023 Biden administration drawdowns, reaching 415 million barrels by late February 2026, where they had been sitting flat for a month when the Hormuz crisis began. The reserve has fallen every week since. It was 374 million barrels on May 15, 307.7 million on July 24, and 285.4 million in the week to September 4: a draw of 130 million barrels and the lowest level since November 1982. Out of the 400 million barrels the IEA’s members committed on March 11, the US authorized 172 million, which would leave the reserve near 243 million when the release is fully delivered.
That makes 2026 the second largest drawdown in the reserve’s history rather than the largest. The 2022 response to Russia’s invasion of Ukraine released 180 million barrels over six months, and counting the congressionally mandated budget sales alongside it the SPR fell 247 million barrels between January 2022 and its July 2023 trough. Earlier drawdowns were far smaller: 17 million barrels during Desert Storm in 1991, 11 million barrels after Hurricane Katrina in 2005, and 30 million barrels during the Libyan civil war in 2011.
The figure to watch in 2026 is the rate rather than the volume. The SPR is rated to deliver 4.4 million barrels a day. Through the worst supply disruption since the 1970s it has peaked at about 1.4 million barrels a day, in the week to May 15, and averaged under 0.7 million, which is roughly the pace of 2022. A rated capacity describes the plumbing on paper. What a reserve delivers under pressure is set by the condition of the wells, pumps and pipelines, and by how much of the inventory sits behind a cavern that is out of service, which is why a May 2026 Government Accountability Office review finding more than a quarter of the remaining barrels undeliverable matters more than the headline number does. Refilling to design capacity from here would take about sixteen years at the roughly 2 million barrels a month the 2023 to 2025 refill managed, and it is politically and fiscally constrained on top of that, leaving the US with materially less SPR firepower available for the next disruption.
Table 12-3: US SPR Key Statistics (September 2026)
| Design capacity | 714 MMbbl |
| Pre-crisis fill (Feb 27, 2026) | 415.4 MMbbl |
| Current fill (week to Sep 4, 2026) | 285.4 MMbbl |
| Rated sustained drawdown rate | 4.4 Mbpd |
| Peak rate achieved, 2026 | about 1.4 Mbpd (week to May 15) |
| Time to market | 13 days from order |
| Storage sites | Bryan Mound, Big Hill, West Hackberry, Bayou Choctaw |
| Largest release ever | 180 MMbbl, 2022 (Ukraine); 172 MMbbl authorized in 2026 |
US Strategic Petroleum Reserve, 1977 to 2026
Estimated Global Strategic Reserves (2025, million barrels)
Table 12-4: SPR Presidential Actions
| President | Action | Volume (mil bbl) | Year | Context |
|---|---|---|---|---|
| Ford | Created SPR | 0 (first fill) | 1975 | Post-embargo Energy Policy and Conservation Act |
| Carter/Reagan | Initial fill | 0 to 500 | 1977 to 1985 | Filled primarily with Mexican and North Sea crude |
| Bush (41) | Desert Storm release | -17 | 1991 | First emergency drawdown, IEA-coordinated |
| Clinton | Test sale | -28 | 1996 to 1997 | Budget deficit reduction (controversial non-emergency use) |
| Bush (43) | Katrina/Rita release | -21 | 2005 | Hurricane damage to Gulf Coast refining |
| Bush (43) | Refill to peak | to 727 | 2005 to 2009 | Post-Katrina refill brought SPR to all-time high |
| Obama | Libya release | -30 | 2011 | IEA-coordinated, Libyan civil war supply disruption |
| Obama | Budget sales | -58 | 2015 to 2016 | Bipartisan Budget Act mandated sales for deficit reduction |
| Trump | Budget sales | -35 | 2017 to 2020 | Continued congressionally mandated sales |
| Biden | Emergency drawdown | -180 | 2022 | Largest SPR release, post-Russia invasion price spike |
| Biden | Partial refill | +35 | 2023 to 2024 | Bought back at $70 to $80/bbl after selling at $90 to $100/bbl |
| Trump | Emergency drawdown | -172 authorized | 2026 | Hormuz crisis; 130 MMbbl delivered by early September, the lowest SPR level since 1982 |
The SPR has been used as a political tool by every president since its creation. The Biden 2022 drawdown was historically unprecedented in scale: 180 million barrels released over six months, more than ten times the Desert Storm release and six times the Libya release. The subsequent partial refill at lower prices partially vindicated the decision financially, but the SPR remains far below its 2009 peak of 727 million barrels. The 2026 Hormuz release is the first drawdown to approach the 2022 one in size, and it began from a reserve that had recovered barely a quarter of what 2022 took out.
The SPR can release crude through three mechanisms. A drawdown and sale is an outright auction, used in genuine emergencies. An exchange lends oil to a refiner who agrees to return a slightly larger volume later, useful for short-term logistical bottlenecks like a closed ship channel. A test sale is a small pre-planned release to verify that the equipment and contracting machinery still work. The IEA co-ordinates releases among member countries when a shock is judged to be global rather than national.
International Strategic Reserves
The US is not alone in holding strategic oil stocks. IEA member countries are required to hold at least 90 days of net oil imports in emergency reserves, and several non-IEA countries have built strategic stockpiles of their own. Global strategic and compulsory reserves are estimated at 1.5 to 1.8 billion barrels.
Table 12-5: International Strategic Petroleum Reserves (2025 Estimates)
| Country | Estimated Volume | Notes |
|---|---|---|
| China | 500-600 MMbbl | Estimated from satellite imagery and import-throughput analysis |
| US (SPR) | 413 MMbbl | 714M design capacity; 413M after partial refill from 2022 lows |
| Japan (NRZS) | 140 MMbbl | Government plus private compulsory stocks |
| South Korea | 95 MMbbl | KNOC government and industry obligation |
| India (ISPRL) | 40 MMbbl | Three sites: Visakhapatnam, Mangalore, Padur |
| EU/IEA members | varies by country | 90-day IEA obligation; mix of government and compulsory industry stocks |
Figure 12-9: Global Strategic Petroleum Reserves by Country/Region, 1977 to 2026
Sources: EIA Weekly Petroleum Status Report (US SPR series WCSSTUS1), DOE SPR Quick Facts, JOGMEC, KNOC, IEA Emergency Response Reviews
The American reserve fell by nearly half between 2020 and 2023 while most other countries’ holdings stayed close to flat, and the reason has more to do with who owns the barrels than with who kept their nerve. The IEA obligation can be met three ways: government stocks, agency stocks held by a central stockholding entity set up for the purpose, or compulsory industry stocks, meaning barrels a refiner or importer is required by law to keep in its own commercial tanks. Most members use a combination. Japan holds roughly 90 days of net imports as government stock through JOGMEC and separately obliges industry to carry the equivalent of 70 days of consumption. Spain splits a 92-day obligation between its central agency, CORES, at 42 days and industry at 50. The United States sits at one extreme, meeting its entire obligation with the SPR and imposing no minimum stock obligation on American refiners at all.
That difference decides what a release looks like. A government holding its own crude sells barrels, and its published reserve total drops by exactly the amount sold. A government leaning on an industry obligation releases oil by lowering the required days of cover, which permits refiners to run down tanks they already own. Oil reaches the market under both methods, but the second one moves commercial inventory rather than a strategic total, so the strategic figure barely moves. A flat line is therefore weak evidence that a country did nothing.
The SPR also does something no other reserve does, which is raise money. Congress has repeatedly ordered sales to fund unrelated spending, beginning with the Bipartisan Budget Act of 2015 and continuing through most of the following decade, so a large part of the American decline was never a response to an oil emergency at all. Set the mandated budget sales alongside the 180 million barrel release of 2022 and the drawdown that began in February 2026, and the American line is carrying three unrelated stories at once: deficit financing, price intervention, and war.
One caution on reading the flat lines too literally. Other members do not publish weekly stock levels the way the EIA does, so the non-American series here are anchored on annual estimates and carried between them. Part of that flatness is real and part of it is the resolution of the available data.
China built its strategic petroleum reserve from zero in 2004 to an estimated 500 to 600 million barrels by 2023, making it the largest national strategic stockpile in the world by volume. The build-out happened across three phases: Phase I (Zhenhai, Dalian, Huangdao, Dushanzi), Phase II (Lanzhou, Tianjin, Zhoushan), and Phase III using commercial tank capacity under government contract. China’s SPR purchases were a significant driver of marginal oil demand during the 2015 to 2023 period, a fact often underappreciated in price analysis. China does not publish precise SPR levels. Estimates come from satellite imagery of tank utilization and import-minus-refinery-throughput calculations.
The 2024 to 2025 build was larger and more important. Beijing added an estimated 200 to 300 million barrels of strategic and commercial-state inventory across that two-year window, taking the combined stockpile toward 800 million barrels by early 2026. The pace absorbed roughly 700 thousand to 1 million barrels per day on average over those two years, equivalent to a meaningful share of total global oil demand growth in the period. Headline IEA and OPEC demand-growth figures during 2024 and 2025 effectively reflect Chinese strategic buying as much as combustion; a substantial fraction of the “demand” was steel and concrete, not engines. The strategic motivation was visible in advance: Beijing was positioning for exactly the kind of Middle East supply disruption that materialized in February 2026, and the buying gave China the largest commercial-plus-strategic onshore crude buffer in history at the moment the Strait of Hormuz closed.
Iran’s Floating Shadow Storage
Strategic reserves on land are easy to count. Crude held at sea on opaquely-flagged tankers is not. Since the Western sanctions tightening of 2022, Iran has used a network of older tankers, often with falsified or absent AIS signals, to circumvent restrictions on its exports. The same fleet is used to hold cargoes off the books for weeks or months at a time when buyers cannot be lined up or when prices favor delay.
Pre-2022, this kind of shadow inventory was a minor part of the seaborne oil market. By 2025 it had become a structural feature: Kpler and Vortexa estimate Iran was carrying 100 to 180 million barrels of crude at sea on shadow-fleet tankers in the months before the strait closure, with an additional reservoir of partially-sanctioned Russian and Venezuelan tonnage maintaining tens of millions more barrels in similar opaque configurations. The aggregate dark-fleet inventory globally is estimated at roughly 250 to 400 million barrels.
The 2026 strait closure activated this hidden reserve. Tankers anchored off Malaysia and Singapore began discharging cargoes to Chinese, Indian, and Pakistani buyers; onshore Iranian tank farms drained into the fleet faster than the fleet could discharge; and the official OECD inventory numbers, which only count tracked commercial storage, understated the system’s actual buffer through the spring of 2026. Roughly 15 days of strait-outage supply was sourced from this layer in the first three months of the crisis. The shadow fleet is a real feature of modern oil markets, not a minor sanction-evasion footnote.
The Contango Storage Play
When the forward curve is in contango, later-dated futures trade above prompt prices. If the spread between a front-month contract and, say, the contract 12 months out exceeds the all-in cost of holding a barrel for a year, a trader can lock in a riskless profit: buy spot crude, put it in a tank, sell a one-year forward, and deliver into the short a year later. The "cost of carry" that has to be covered includes tank rent, insurance, financing interest, and a small allowance for shrinkage from evaporation and sampling.
In normal markets contango is shallow and only the cheapest storage (salt caverns, lowest-rate terminal tanks) gets filled. In stressed markets contango deepens until even expensive floating storage on VLCCs becomes economic. That happened in April and May 2020: one-year WTI contango briefly exceeded $15 per barrel, and more than 150 million barrels of crude were chartered onto tankers as floating storage. Chapter 11 (Transporting Oil) treats the shipping side; Chapter 18 (Futures and Swaps) develops the mechanics of contango and the forward curve in more detail.
Inventory Reports and the Five-Year Range
Weekly inventory reports are the single most-watched storage numbers in global oil. The EIA's Weekly Petroleum Status Report, published every Wednesday at 10:30 AM Eastern (Thursday after a Monday holiday), breaks out crude, gasoline, distillate, jet, and residual fuel stocks by PADD region, along with a separate line for Cushing. The market convention is to chart each product against its five-year range, a shaded band showing the minimum and maximum week-by-week values over the prior five years. Stocks inside the band are "normal"; stocks pushing above or below it are the headline.
The day before the EIA release, the American Petroleum Institute publishes its own private survey on Tuesday afternoon. The API number is released to subscribers and leaks within seconds; prices typically move on the API number and then move again on the official EIA print. On Thursdays the EIA publishes the Weekly Natural Gas Storage Report, the corresponding gas-market release, which is read against its own five-year range. The IEA publishes monthly OECD commercial stock data that plays the same role for the global picture.
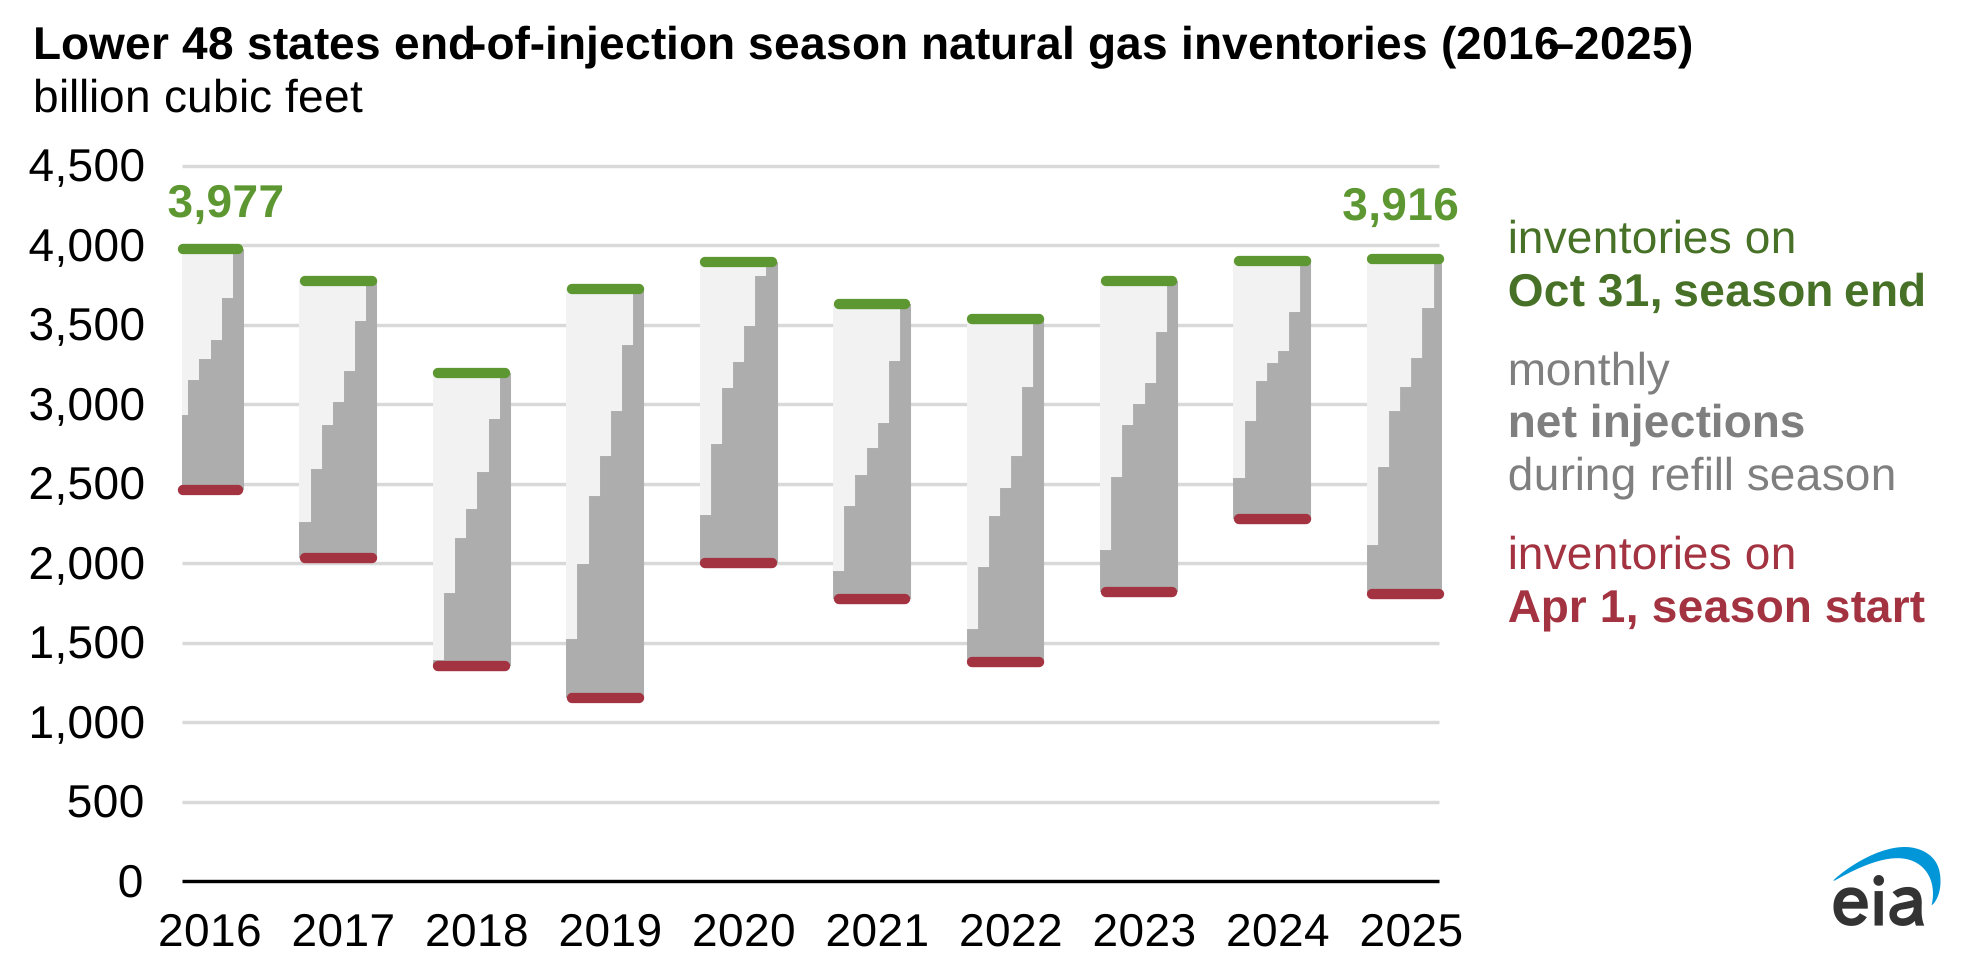
A single supertanker carrying 2 million barrels that has not yet been counted by the EIA survey can swing the weekly number enough to move global prices by a dollar. This is why predicting the Wednesday print is a weekly sport, and why the five-year range matters more than any single data point.
AI and the 30 Percent Inventory Reduction
The largest change in oil storage over the past decade shows up nowhere in any tank or terminal. It is a structural reduction in the working inventory the global oil system needs to run, driven by machine-learning demand forecasting and real-time supply-chain telemetry. The toolkit is unglamorous: boosted-tree demand forecasters (XGBoost-class models are the workhorse), AIS-derived shipment nowcasting, refinery-turnaround coordination shared across counterparties, retail offtake telemetry from thousands of points of sale, predictive maintenance flagging unplanned outages before they happen. None of it produces headlines.
The cumulative effect is large. Industry estimates of the structural reduction in days of cover across the supermajors and the larger national distribution networks are on the order of 30 percent. Applied to the roughly 3 billion barrels of OECD commercial crude and product inventory, the reduction represents close to 1 billion barrels of structural buffer that did not exist a decade ago. BP disclosed working capital reductions of roughly 22 percent attributed to AI-enabled inventory management (Energies Media, “AI in Supply Chain Management: Real Results from Top Energy Companies in 2025,” April 2025), and similar disclosures from Shell, Equinor, and the major trading houses suggest the figure is industry-wide rather than idiosyncratic.
The Hormuz crisis tested the buffer. Between February 28 and early May 2026, OECD commercial inventories fell roughly 190 million barrels with no visible scrambling in the physical market. The same drawdown in 2010 would have produced on-screen panic and likely triggered a $200-plus Brent print. It did not in 2026 because the system now operates with materially less stockpile per barrel of throughput than it did even five years ago. Tracking tanker AIS data was the cutting-edge analytical tool of 2010; everyone has it now. The next analytical edge is in the silent AI-efficiency layer that does not show up in the inventory tally.
The buffer is not infinite. SPR refill is slow and politically expensive. The shadow fleet is finite and being drawn down. Inventory efficiency only buys time, not new supply. But for the duration of a normal supply disruption, the combination of strategic reserves, the shadow fleet, and the AI-enabled inventory layer adds up to roughly 130 days of buffer at the 12 million barrel per day shut-in rates of early 2026. That cushion is the central reason oil prices have not traded at $200 or higher despite a fundamental supply disruption worse than 1973 or 1979.
Where Storage Sits in the Value Chain
Storage is the quiet utility that makes the rest of oil work. Without operational tankage, refineries would shut every time a tanker ran late. Without strategic reserves, a Strait of Hormuz closure would become a months-long economic crisis rather than a weeks-long one. Without commercial storage, the futures curve would have no physical arbitrage mechanism and contango would mean nothing. And without the silent AI inventory layer, the marginal barrel of stockpile would still cost the system what it cost ten years ago. The next chapter turns to seasonality, the largest predictable source of storage draws and builds, and then Chapter 14 (Reserves) covers the reserves that sit underground waiting to become inventory in the first place.
The above was updated in 2026. For the full original 2009 chapter, download the 1st edition 2009 PDF.