Chapter 13
Seasonality
Oil market seasonality: driving season, heating oil demand, refinery turnarounds, and how seasonal patterns shape crude prices.
Four Overlapping Calendars
Oil is one of the most seasonal commodities in the world, yet crude itself trades with surprisingly flat seasonality. That paradox is the heart of this chapter. The products that come out of a barrel, gasoline, diesel, jet, heating oil, bunker, propane, have sharply different demand shapes across the year, and the calendars of refining, weather, and shipping push against each other. Add them up at the crude level and most of the seasonality cancels.
Four overlapping cycles govern the oil year. The driving season runs from April through September and peaks in July and August. The heating season runs from October through March and peaks from December through February. The refinery turnaround calendar puts most scheduled maintenance in the shoulder months of February through April in the spring and September through October in the fall. The Atlantic hurricane season runs from June 1 to November 30 and concentrates its serious storms from mid-August to mid-October, squarely on top of peak driving demand and the fall turnaround window. Traders who cover the physical market keep all four calendars in their heads at once.
Gasoline: Memorial Day to Labor Day
US gasoline demand varies roughly 8 to 10 percent from trough to peak across a normal year. The trough is January and February when driving is minimal, the peak is July and August when vacation travel stacks on the normal commute. The traditional framing in the trade is "Memorial Day to Labor Day": the late-May holiday kicks off the heavy driving weeks, early-September ends them. The post-Labor Day drop is classic back-to-school weakness, visible in every year of EIA weekly product supplied data.
Table 13-1: Typical US Gasoline Demand by Month (index, annual average = 1.00)
| Month | Demand Index | Notes |
|---|---|---|
| January | 0.93 | Annual trough, weather and holiday hangover |
| February | 0.94 | Still weak, short month |
| March | 0.98 | Spring break starts to lift demand |
| April | 1.00 | Transition month, terminals switching to summer grade |
| May | 1.03 | Memorial Day weekend kicks off the season |
| June | 1.05 | Driving season ramp |
| July | 1.07 | Peak vacation travel |
| August | 1.08 | Annual peak |
| September | 1.02 | Labor Day cliff, back to school |
| October | 0.99 | Shoulder, fall driving |
| November | 0.97 | Thanksgiving travel blip |
| December | 0.96 | Holiday travel partially offsets weather |
Figure 13-2: US Gasoline Demand by Month (Mbpd)
Source: EIA Monthly Energy Review (illustrative). The summer driving season peak (June to August) is consistent across years, but COVID-19 in 2020 broke the pattern with a sharp April collapse.
The peak-to-trough ratio of about 1.16 understates how these swings hit the refining system. An 8 percent move on a US gasoline pool of 9 million barrels per day is 700,000 bpd of incremental supply the system has to deliver between February and August. That swing is why refineries run max gasoline mode in summer and switch toward distillate in winter, trading roughly 2 percent of yield between the two barrels depending on cat cracker feed slate and severity.
Summer Grade and Winter Grade: The RVP Calendar
US gasoline is not a single product across the year. Environmental rules force a switch between a higher-volatility winter blend and a lower-volatility summer blend measured by Reid Vapor Pressure (RVP). What goes into each blend, butane, reformate, alkylate, ethanol, is covered in Chapter 9 (Finished Products). Here the point is the calendar: the dates are hard deadlines that every refiner, terminal operator, and marketer has to plan around.
Table 13-2: US Federal Gasoline RVP Transition Dates
| Date | Event | Maximum RVP |
|---|---|---|
| May 1 | Summer spec required at refineries and terminals | 7.8 psi federal, 7.0 or 6.5 psi CARB |
| June 1 | Summer spec required at retail stations | 7.8 psi federal |
| Sep 15 | Winter spec allowed again (retail) | 9 to 15 psi |
The tightest specs apply in California under CARB rules and in specific ozone non-attainment areas, where summer RVP can be as low as 6.5 psi and the switch starts earlier. The April to June transition creates what traders call the orphan barrel problem: winter-grade gasoline sitting in a terminal on May 1 cannot legally move into the summer retail distribution system, and the owner has to either re-blend it down, export it, or sell it at a deep discount. The equivalent problem runs in reverse in September when summer product is worth less than winter product at wholesale because winter butane blending can replace it more cheaply.
Winter gasoline uses more butane, which is cheap, plentiful, and has a very high blending RVP. Summer gasoline pushes butane out and pulls in more alkylate and reformate, which are more expensive. The wholesale gasoline crack spread widens through May and June as summer-grade supply tightens, and compresses in September when butane returns. See Chapter 9 (Finished Products) for the blendstock economics behind the switch.
Heating Oil, Propane, and the HDD Framework
Winter demand for space heating is measured in Heating Degree Days (HDD), the number of degrees the daily average temperature falls below a 65 F baseline, accumulated across the month or the season. A day averaging 40 F contributes 25 HDD; a day at 70 F contributes zero. The summer mirror is Cooling Degree Days (CDD) on the same 65 F baseline, which drives power generation and therefore natural gas burn rather than oil burn in most of the US. Utilities, gas marketers, and weather derivative desks quote exposures in HDD and CDD, and the weekly EIA natural gas storage report is effectively a commentary on the last week's HDD relative to the 10-year normal.
US heating oil demand builds from October, peaks in January and February, and falls off sharply in April. The Northeast corridor from New York through Maine is the core market, and it is the reason the historical oil product futures contract at the New York delivery point was originally written on heating oil before being relaunched as ultra-low-sulfur diesel. Western Europe is the world's largest heating oil consumer, with France and Germany still running large installed bases of oil-fired boilers despite decades of gas and heat pump substitution. Japan and Korea use kerosene rather than heating oil as the residential winter fuel, which creates a direct seasonal tug-of-war with jet fuel since both come from the same middle-distillate cut.
Propane has an even more concentrated winter peak in the US because it heats rural homes that are not on a natural gas grid, and because it dries the fall corn crop in the Midwest. A wet harvest in October can spike Mont Belvieu and Conway propane prices before the heating season has even started, and a cold January in the Northeast can push retail propane above $4 a gallon when the pipeline and rail system cannot refill local storage fast enough.
Natural Gas Storage: Inject and Withdraw
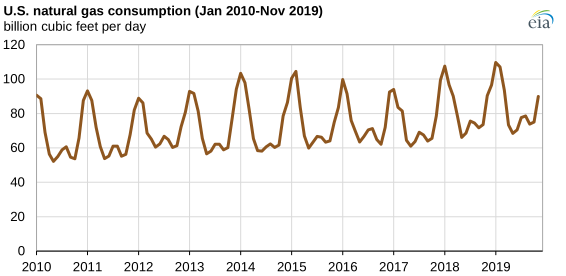
Natural gas storage runs on a clean six-month rhythm. The injection season runs from April through October, when mild weather and low heating demand let producers push gas into salt caverns and depleted reservoirs. The withdrawal season runs from November through March, when cold weather pulls that gas back out to meet heating load. EIA publishes a weekly storage report every Thursday at 10:30 am Eastern that is one of the most watched data points in the energy complex, and the chart every analyst has open is the current year's inventory trajectory overlaid on the 5-year range and the 5-year average.
US natural gas storage seasonality now feeds directly into global oil and LNG markets. European winter demand can be met by pulling on US LNG exports, so a cold January in Germany shows up as a draw on Gulf Coast gas and a firming of the Henry Hub winter strip. The linkage was invisible before 2016; after 2022 it is one of the most watched cross-market relationships in the energy business. See Chapter 24 (US LNG) for the export infrastructure and Chapter 12 (Storage) for salt cavern and depleted reservoir mechanics.

The Refinery Turnaround Calendar
Refineries run hardest during the two demand peaks, summer gasoline and winter heating oil. The only window to take units offline for scheduled maintenance is the shoulder season between them. That is why US refinery utilization dips in February through April and again in September through October, and why crude runs follow a seasonal pattern that is as much a supply story as a demand one.
Table 13-3: Typical US Refinery Utilization by Month
| Month | Utilization | Driver |
|---|---|---|
| January | 87% | Full heating oil mode |
| February | 86% | Spring turnarounds begin |
| March | 86% | Turnaround peak |
| April | 89% | Gasoline build, summer grade switch |
| May | 92% | Pre-Memorial Day push |
| June | 94% | Driving season |
| July | 95% | Annual utilization peak |
| August | 94% | Peak, hurricane risk rising |
| September | 90% | Fall turnarounds, storm outages |
| October | 89% | Turnaround tail |
| November | 90% | Heating oil build |
| December | 91% | Winter mode |
US crude throughput peaks in July and August at roughly 17 Mbpd and drops by about a million barrels per day during the fall turnaround window. That predictable swing in crude demand is part of why WTI physical differentials firm into summer and soften in September and October, even in years without any unusual production news.
Atlantic Hurricanes
The Gulf of Mexico hosts roughly 15 percent of US crude production and 45 percent of US refining capacity, concentrated along the corridor from Corpus Christi through Houston, Port Arthur, Lake Charles, Baton Rouge, and into the lower Mississippi. Atlantic hurricane season runs from June 1 to November 30, and the climatological peak falls between mid-August and mid-October. The heaviest storm risk coincides with the summer driving season and the fall refinery turnaround window, the worst possible calendar overlap for the gasoline market.
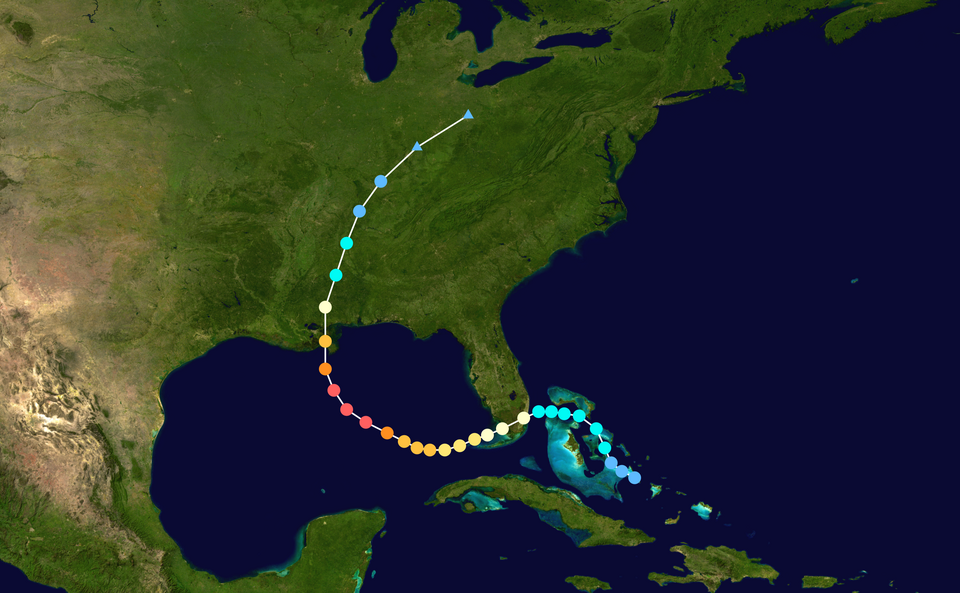
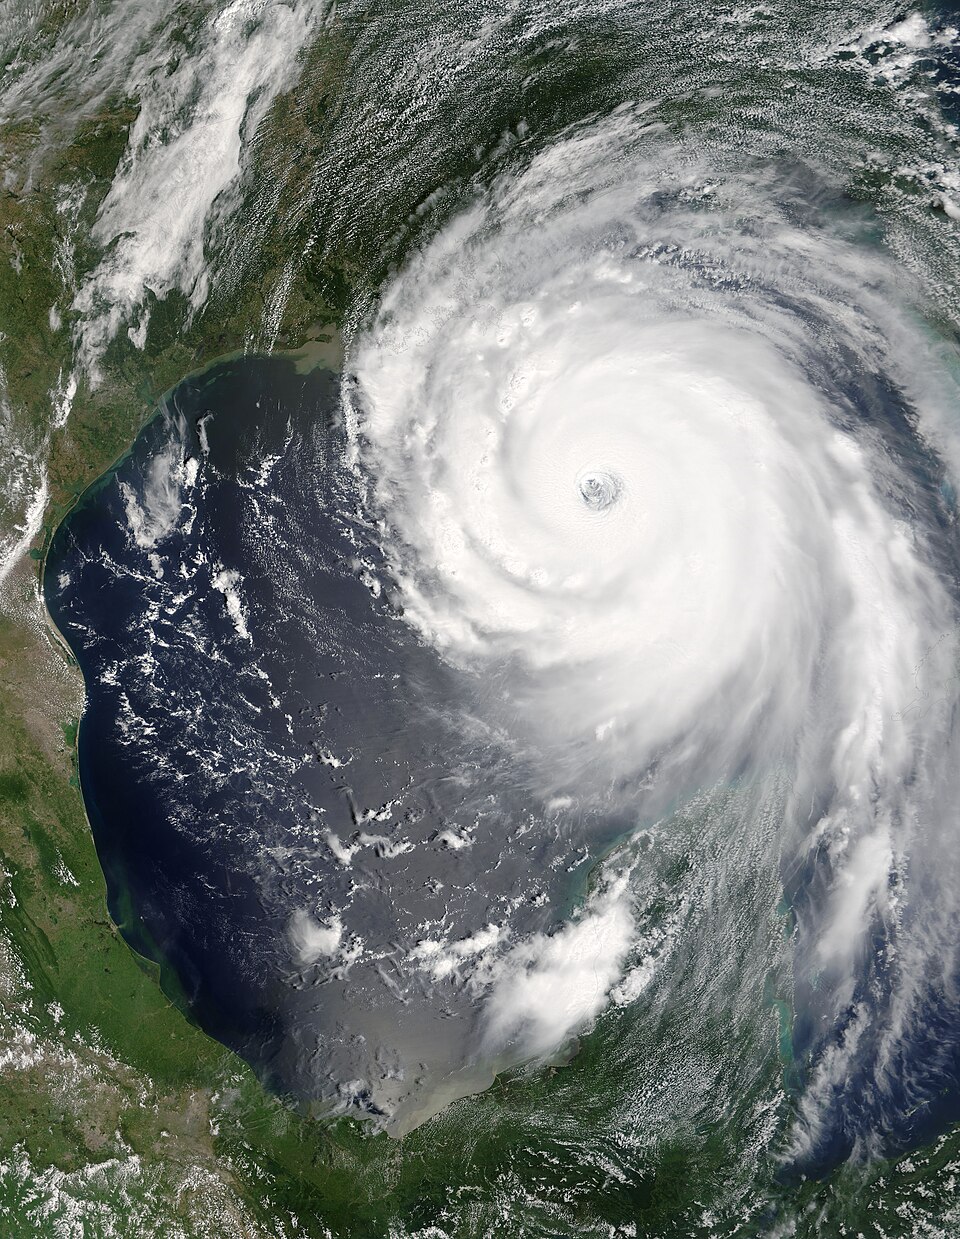
Table 13-4: Major Hurricane Impacts on US Oil Infrastructure
| Storm | Year | Impact |
|---|---|---|
| Katrina + Rita | 2005 | 25% of US refining offline for weeks; Louisiana offshore shut in; SPR release; retail gas spike to $3+ |
| Ike | 2008 | Houston Ship Channel and Galveston refineries hit; 20% of US refining curtailed |
| Harvey | 2017 | Flooded Houston/Port Arthur refineries; 23% of US capacity offline; Colonial Pipeline delays |
| Laura + Delta | 2020 | Lake Charles refining and petrochemical complex damaged; Citgo and Phillips 66 units offline for months |
| Ida | 2021 | Louisiana offshore production shut in for more than a week; LOOP disrupted; Norco and Convent refineries offline |
| Beryl, Francine, Helene | 2024 | Short-duration Gulf shut-ins, limited refining damage; storm count above average but landfall impacts on oil infrastructure were modest |
Storm risk is priced into gasoline futures every summer through the September gasoline crack, which trades at a premium over the August and October contracts to reflect the chance of a Gulf shut-in. When a named storm enters the Gulf and the models agree it is heading for the Texas or Louisiana coast, RBOB futures and Gulf Coast physical differentials can move 10 to 20 cents a gallon in a session. If the storm misses, they give it back. If the storm hits a major refining center, the move extends for weeks.
North Sea Storms and Baltic Ice
Europe has its own winter supply calendar. North Sea platforms and single-point mooring terminals at Sullom Voe in Shetland, Flotta in Orkney, and Teesside on the English coast are routinely disrupted by December through February storms that push significant wave height above the loading limits of shuttle tankers. That is one reason Dated Brent cargo differentials firm in late autumn and why the Brent forward curve often shows a small backwardation bulge in winter months.
The Baltic Sea historically iced over from December through April in an average winter, and Russian crude and product exports through Primorsk and Ust-Luga had to be loaded into ice-class tankers at higher freight rates. After the 2022 sanctions pushed most Russian flow into non-European markets via ship-to-ship transfers and Arctic Kola transshipment, Baltic ice seasonality still exists but matters less to global price formation than before the war.
Rivers and Canals: Low Water Bottlenecks
The Rhine is the spine of inland European product distribution. Barges loaded with gasoline, diesel, and jet at Rotterdam and Antwerp move up the river to refineries, terminals, and airports in Germany, France, and Switzerland. In dry summers the river runs too low at the Kaub chokepoint for barges to load to full depth, and freight rates spike because the same cargo requires more bottoms to move. The 2018 and 2022 droughts were the two worst modern episodes, with barge loadings at Kaub falling to roughly 30 percent of normal draft at the peak of the 2022 low water.
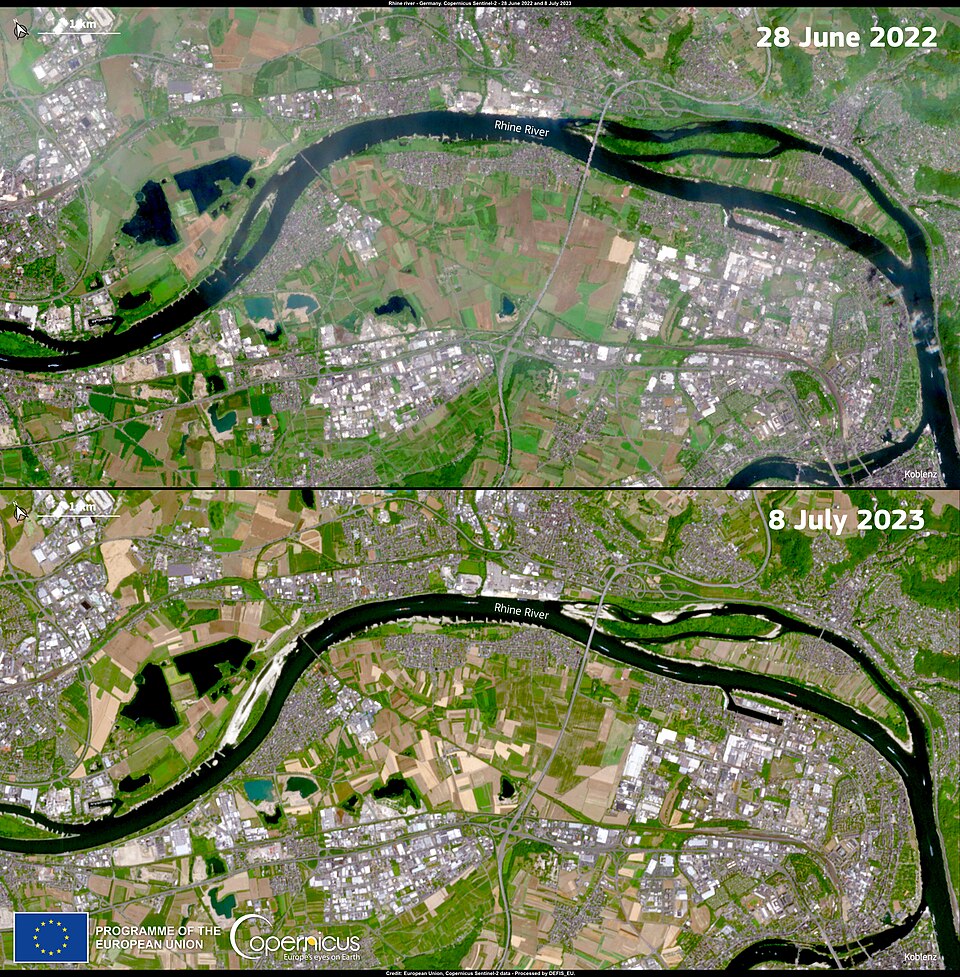
The Panama Canal faced its own drought-driven bottleneck in 2023 and 2024 when low water in Gatun Lake forced the Panama Canal Authority to cut daily transits and draft limits. US Gulf LPG and product cargoes bound for Asia had to queue, divert around Cape Horn, or pay auction premiums for scarce transit slots. See Chapter 24 (US LNG) for the downstream effect on Henry Hub spreads and Asian JKM pricing.
Why Crude Oil Itself Is Less Seasonal Than Its Products
The key insight. Heating oil peaks in winter. Gasoline peaks in summer. Natural gas has both a winter heating peak and a summer power generation peak. Refinery turnarounds pull crude runs down in the shoulder months between them. When you add all of that up at the crude barrel level, the peaks and troughs of the products largely cancel each other out. That is why crude oil itself shows far less seasonal variation in either demand or price than the individual products refined from it. The seasonal trades in oil are almost always in the product cracks, the RVP switch, the gas storage spread, and the hurricane risk premium, not in flat-price crude.
Experienced oil traders treat seasonality as a base layer, not a forecast. The calendar tells you what the market should do in a normal year; the news flow tells you how the current year is deviating from that baseline. A cold January 15 percent above normal HDD, a hurricane dropping 30 inches of rain on Houston, a Rhine falling below Kaub navigable depth, these are the moments when seasonality stops being background and becomes the trade.
The above was updated in 2026. For the full original 2009 chapter, download the 1st edition 2009 PDF.