Chapter 11
Transporting Oil
Oil transportation and logistics: pipelines, tankers, VLCC shipping, rail, trucks, and how crude and products move globally.
Five Methods of Moving Oil
Oil reaches consumers through five transportation methods: tanker ship, pipeline, tank truck, railcar, and (rarely) aircraft. Each serves a different segment of the supply chain. Tanker ships move crude and products across oceans. Pipelines carry oil over land between production sites, refineries, and distribution hubs. Tank trucks handle the final mile to gas stations, homes, and farms. Railcars carry crude, products, and chemicals where pipelines are absent. Aircraft tankering is limited to airlines ferrying jet fuel between their own hubs when regional prices make it economic.
Transportation matters because producing basins and consuming markets are rarely in the same place. Saudi crude has to reach refineries in Japan and Rotterdam. Canadian bitumen has to reach the US Gulf Coast. Gasoline made on the US Gulf Coast has to reach drivers in New York and Atlanta. Every mile of that journey passes through a regulated, standardized, capacity-constrained network, and the spread between producing and consuming regions reflects the cost and scarcity of that network.
Tanker Ships
Just over half of global crude production travels by sea at some stage. The tanker fleet is segmented by deadweight tonnage (DWT) into size classes that determine which terminals, canals, and trades the vessel can serve. The table below is the reference ladder.
Table 11-1: Oil tanker size classes
| Class | DWT range | Typical trade | Typical cargo |
|---|---|---|---|
| Handysize | <10,000 DWT | Coastal, regional | Products |
| Handymax | 25-40,000 DWT | Short-sea, regional | Products |
| MR (Medium Range) | 40-55,000 DWT | USGC to Latin America, intra-Europe | Clean products (gasoline, diesel, jet) |
| LR1 (Long Range 1) / Panamax | 55-80,000 DWT | Transatlantic, India to East Africa | Clean products or crude |
| LR2 / Aframax | 80-120,000 DWT | North Sea, US Gulf, Caribbean, Mediterranean | Crude |
| Suezmax | 120-200,000 DWT | West Africa to Europe, Black Sea | Crude |
| VLCC (Very Large Crude Carrier) | 200-320,000 DWT | Middle East to Asia, Middle East to Europe | Crude |
| ULCC (Ultra Large Crude Carrier) | >320,000 DWT | Largely retired | Crude |
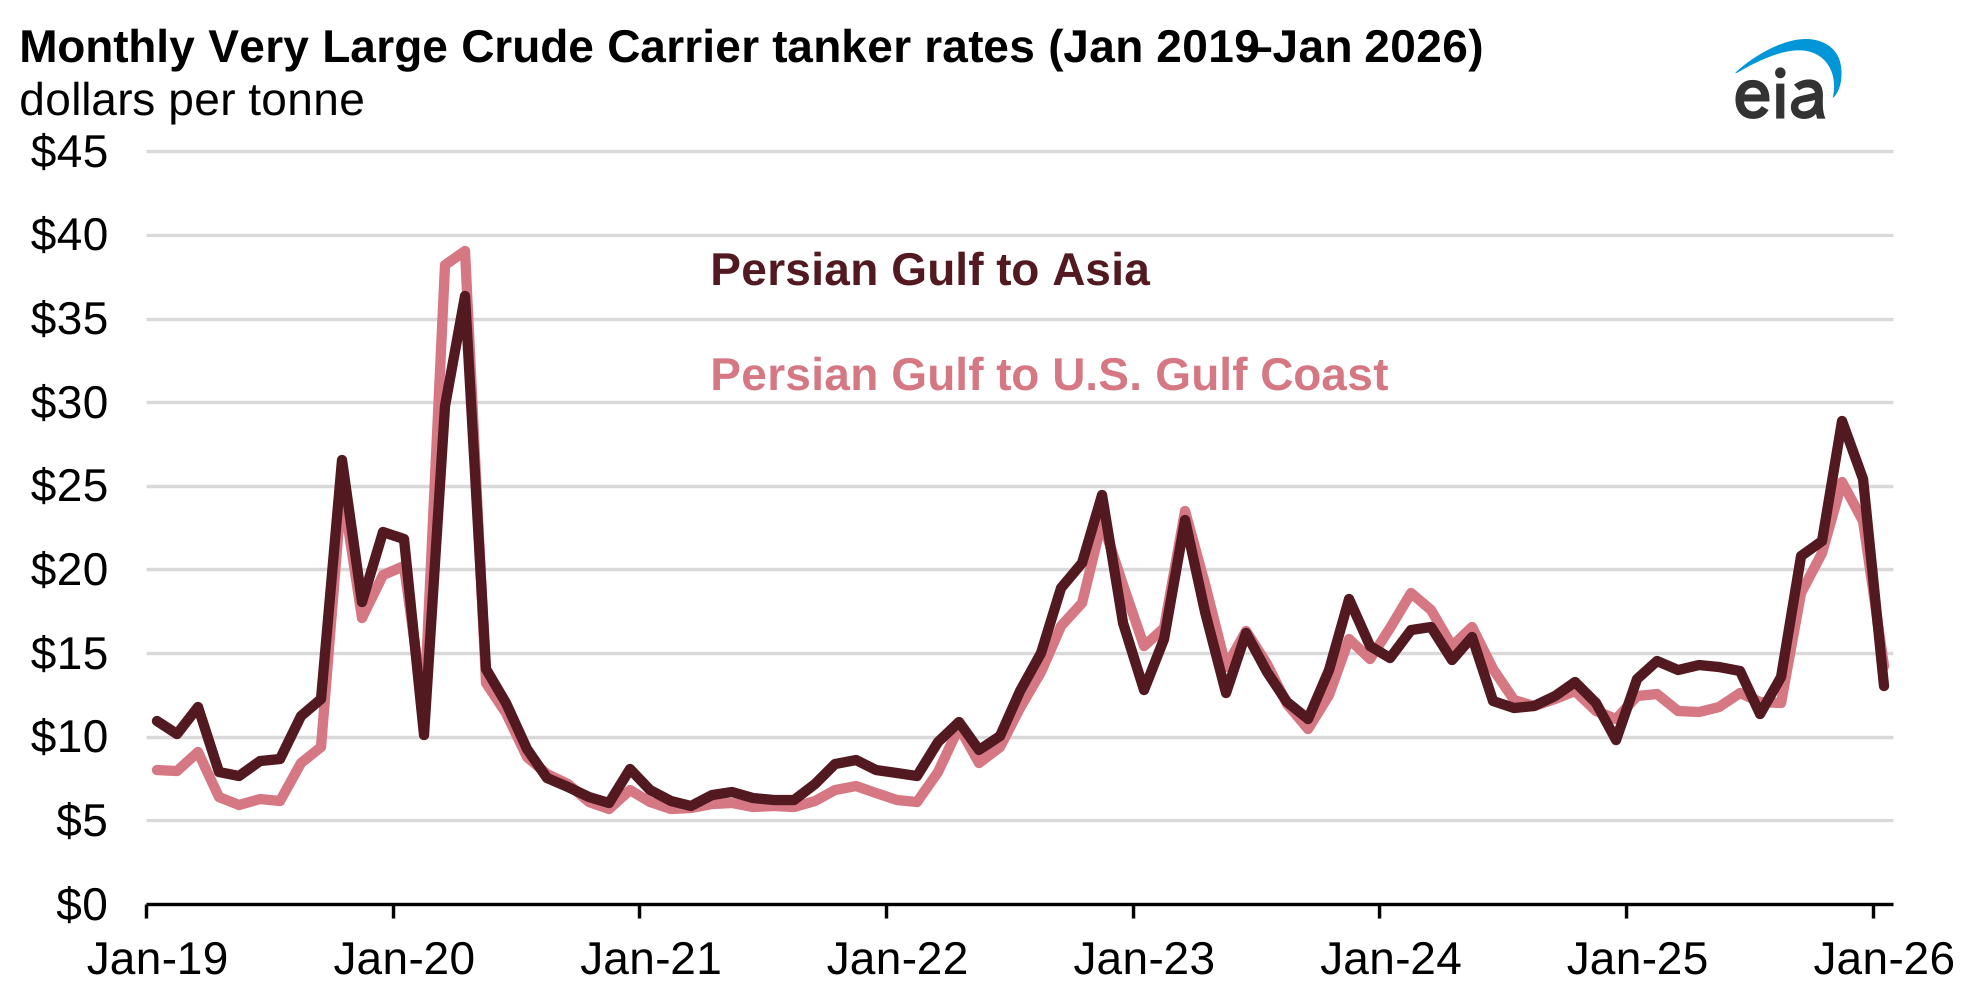
"Aframax" sounds like a brand but is short for Average Freight Rate Assessment Maximum, from the AFRA scale the London Tanker Brokers' Panel used decades ago to classify freight contracts. The name stuck. A VLCC carries roughly 2 million barrels of crude; a single VLCC cargo moving from Ras Tanura to Ningbo can swing a weekly Chinese inventory print. Suezmaxes fit through the Suez Canal fully loaded. VLCCs fit only partially loaded and must reload the balance on the other side, or reroute around the Cape of Good Hope.
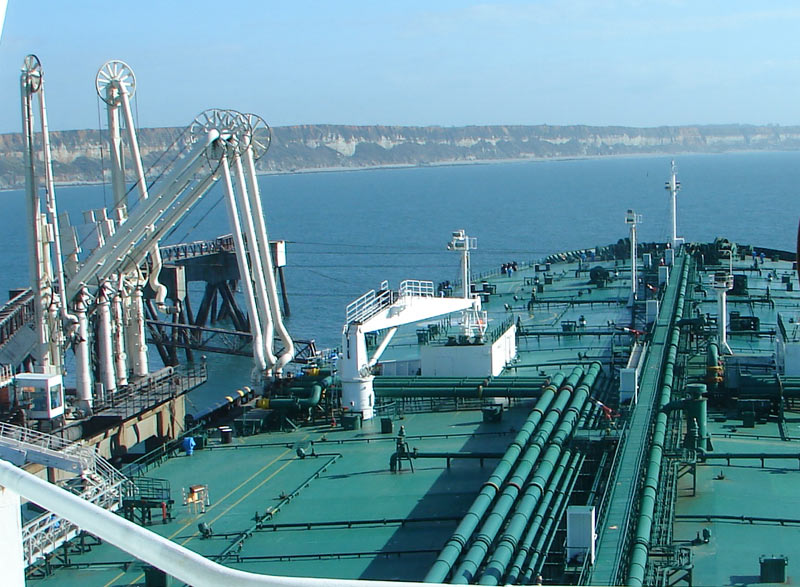
Clean product tankers carry refined products such as gasoline, diesel, and jet fuel in coated or stainless steel tanks that will not contaminate the cargo. Dirty tankers carry crude oil and residual fuel. The distinction matters commercially: switching a vessel between clean and dirty service requires an expensive tank clean and is rarely done. A typical tanker has segregated cargo tanks, segregated ballast tanks to maintain trim when empty, slop tanks to hold tank washings, a pump room forward of the engine room, and an accommodation block aft. OPA 90, passed after the 1989 Exxon Valdez grounding in Prince William Sound, required all tankers calling on US waters to be double-hulled. The IMO followed with a global MARPOL schedule that phased out single-hulled tankers by 2015.
A rough conversion: multiply DWT by 7.5 to estimate barrel capacity. A "boatload" in trading slang is 500,000 barrels, the cargo of a typical MR or LR1. A "bargeload" is 50,000 barrels. A VLCC cargo is often quoted as "a million barrels plus" with the exact figure set by the loadline at the terminal.
Figure 11-2: Global Tanker Fleet by Vessel Class (% of Total DWT, 2024)
Sources: Clarksons Research, UNCTAD Review of Maritime Transport (2024). Shares by deadweight tonnage.
Chartering and Worldscale
Tanker freight is priced using the Worldscale system, annually revised nominal rates published in dollars per metric tonne for a list of standard voyages. Worldscale 100 is set so a standard reference vessel earns a specified daily return on that route. Market charter rates are quoted as a percentage of that nominal: WS 100 equals the nominal, WS 150 is 50% above, WS 80 is 20% below. Brokers quote a single number instead of rebuilding the bunker and port cost stack for every voyage. The Baltic Exchange publishes daily route assessments that serve as the reference for freight derivatives (FFA).
Table 11-2: Worked example: VLCC Ras Tanura to Ningbo at WS 60
| Input | Value |
|---|---|
| Voyage | Ras Tanura (Saudi Arabia) to Ningbo (China) |
| Worldscale flat rate (illustrative) | $18.50 / tonne |
| Market rate | WS 60 |
| Effective freight | $18.50 x 0.60 = $11.10 / tonne |
| Cargo | 300,000 DWT (about 270,000 tonnes of crude) |
| Total freight | $3.0M per voyage |
Pipelines
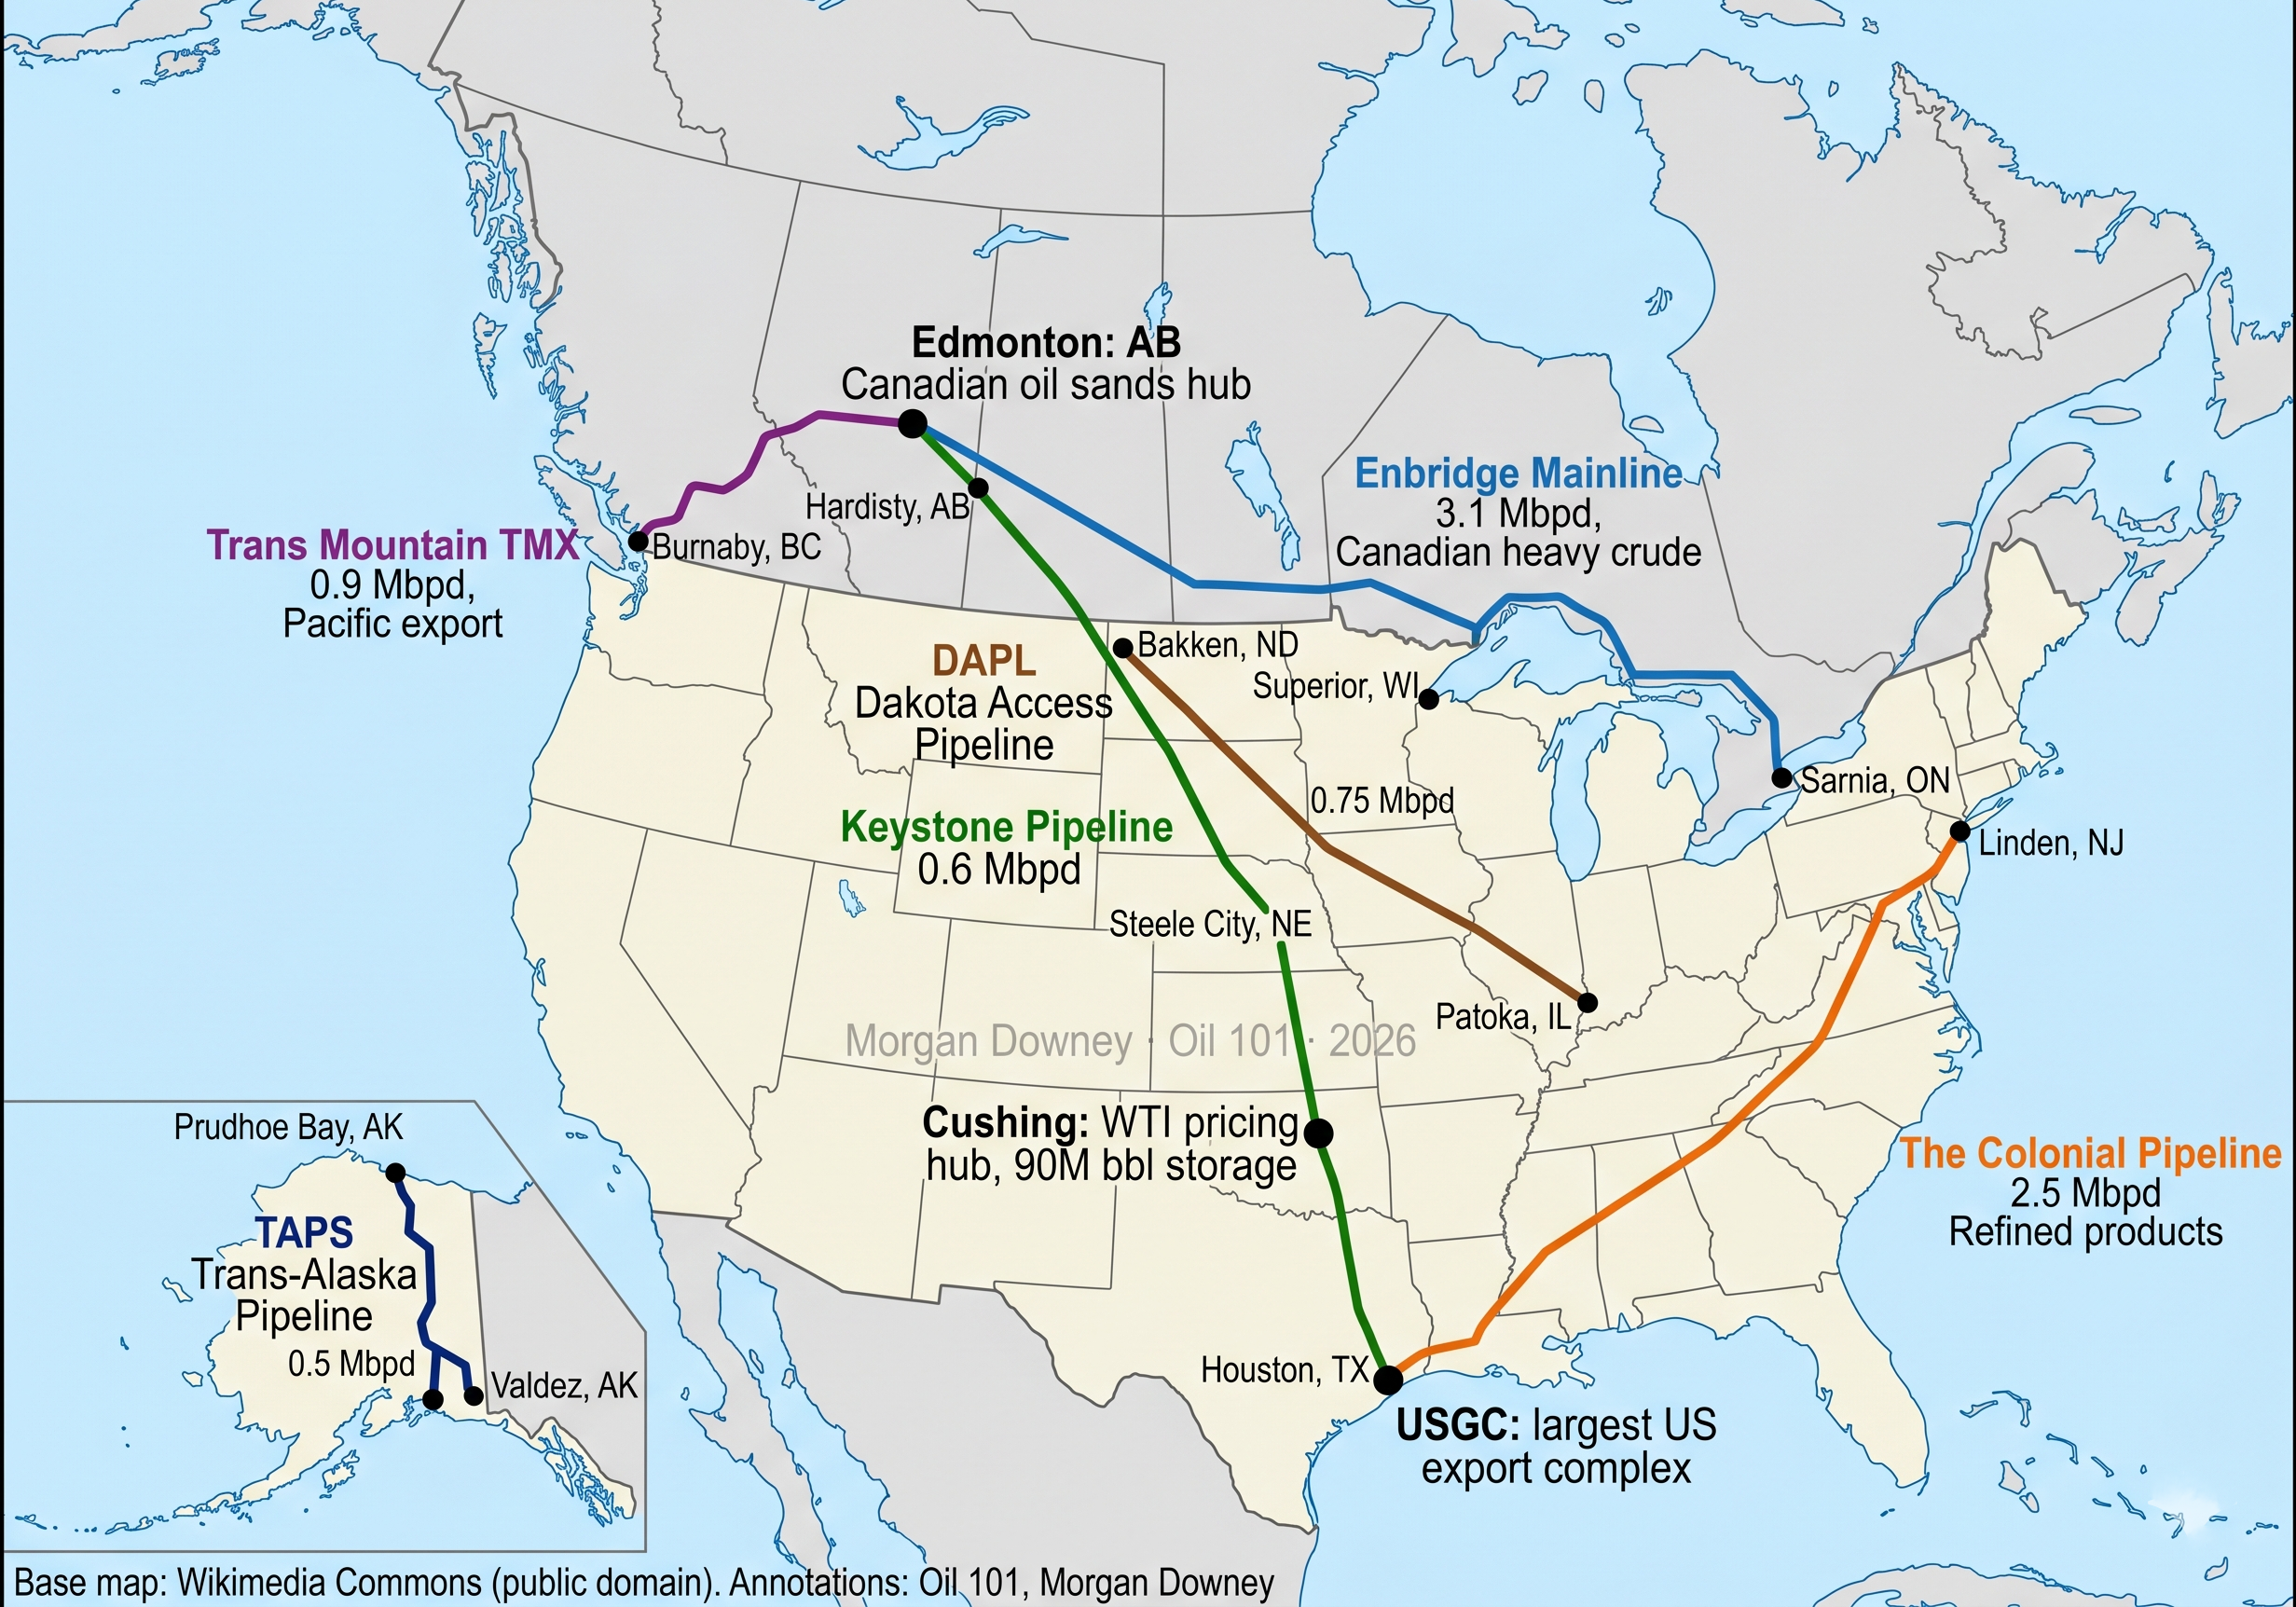
All oil passes through a pipeline at some stage. Black oil pipelines carry crude to refineries. Clean product pipelines move refined fuels from refineries to distribution terminals. The Colonial Pipeline, 5,500 miles from Houston to Linden, New Jersey, moves roughly 40% of US East Coast liquid fuels. Products travel at 3 to 5 mph, with a full journey taking 18 to 20 days.
A few pipeline mechanics matter here. Batching is the practice of pumping different products back to back through the same pipe: a batch of jet fuel, then a batch of diesel, then a batch of gasoline. A small interface zone at each boundary mixes slightly; the interface cut is either rerun through a refinery or downgraded to a less sensitive product. Pigs are pipeline inspection gauges that travel with the fluid to clean wall deposits, separate batches, or, in the case of "smart pigs", take ultrasonic readings of wall thickness to detect corrosion before it becomes a leak. Drag reducing agent (DRA) is a tiny dose of high molecular weight polymer that suppresses turbulent eddies at the pipe wall and can lift throughput 10% to 40% without new pumps. Pump stations sit every 50 to 100 miles to restore pressure lost to friction.
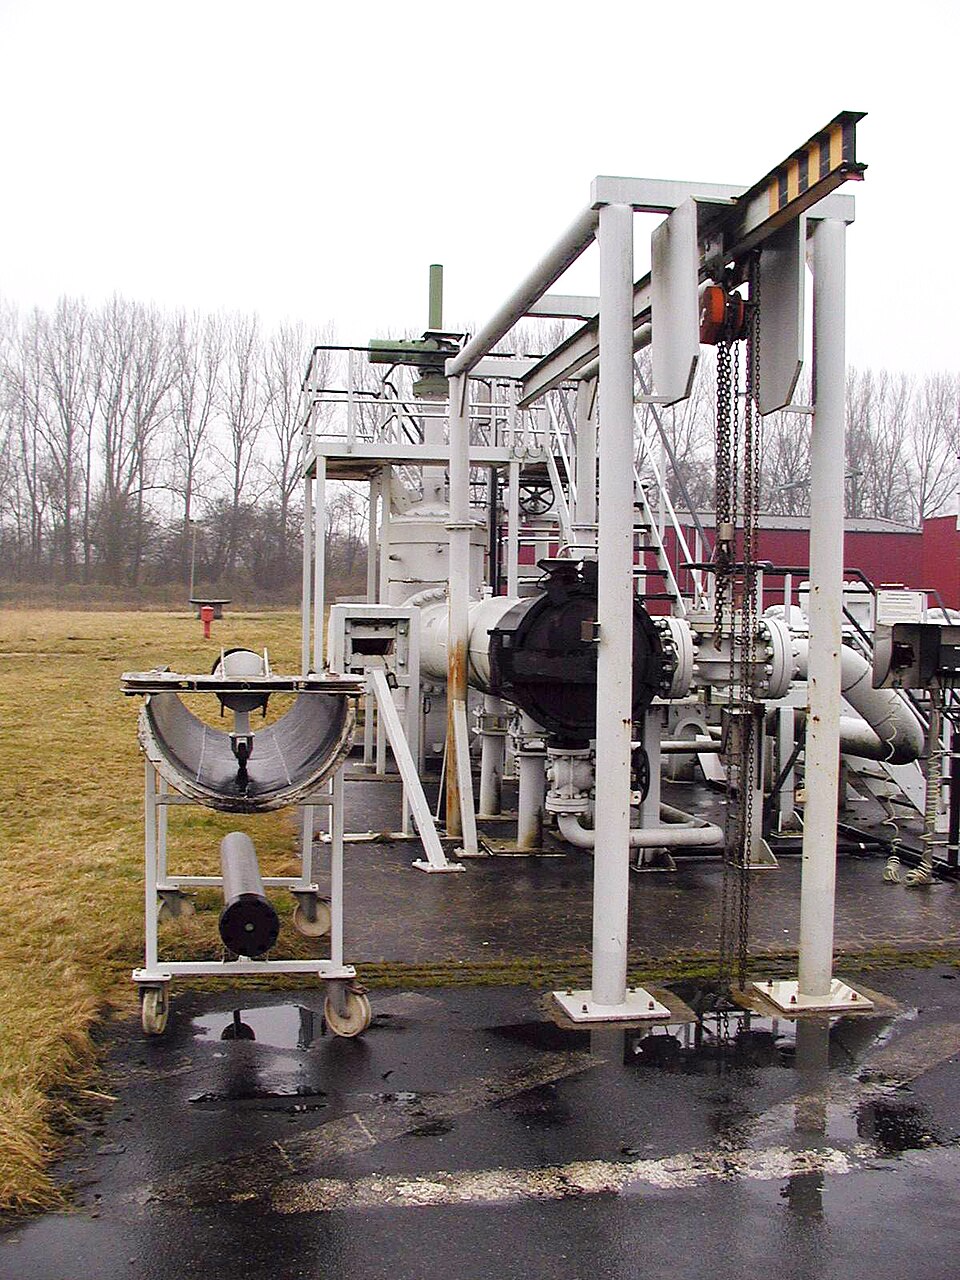
Table 11-3: Major North American crude and product pipelines
| Pipeline | Operator | Route | Capacity |
|---|---|---|---|
| Colonial | Colonial Pipeline Co. | Houston to Linden NJ (products) | 2.5 Mbpd |
| Plantation | Kinder Morgan | Louisiana to Washington DC (products) | 720 kbpd |
| Enbridge Mainline | Enbridge | Alberta to US Midwest (crude) | 3.0 Mbpd |
| Keystone | TC Energy | Alberta to US Gulf (crude) | 620 kbpd |
| Trans Mountain (TMX) | Trans Mountain Corp | Alberta to Vancouver BC (crude) | 890 kbpd (2024 expansion) |
| TAPS | Alyeska | Prudhoe Bay to Valdez AK (crude) | 500 kbpd |
Crude by Rail and the Bakken Boom
Between 2011 and 2015 the US ran a short, intense boom in crude by rail (CBR) as Bakken shale production outgrew pipeline capacity. At the peak, over a million barrels per day of North Dakota light sweet crude moved in unit trains to refineries on the East Coast, West Coast, and Gulf. The boom ended on July 6, 2013, when an unattended runaway train of 72 tank cars carrying Bakken crude derailed and exploded in the center of Lac-Megantic, Quebec, killing 47 people and leveling downtown. The accident forced the phase-out of the old DOT-111 tank car design and the adoption of the thicker-walled, pressure-tested DOT-117 standard. CBR volumes fell as new pipelines came online, but rail remains meaningful for Canadian heavy oil moving to the Gulf, especially when TMX and Enbridge Mainline are apportioned.
Trucking: The Last Mile
Tank trucks deliver the last mile of almost every refined product. Gasoline tankers fan out from terminals to service stations several times a day. Aviation fuel trucks or hydrant-cart systems fuel aircraft on airport aprons. Heating oil trucks fill residential tanks in the US Northeast. Asphalt trucks haul hot bitumen to paving sites. Cost per barrel-mile is high relative to pipeline or marine, so trucking is reserved for short final distances where no larger-volume alternative exists.
IMO 2020 and the Transformation of Bunker Fuel
On January 1, 2020, the IMO's global marine fuel sulfur cap fell from 3.5% to 0.5%, the largest regulatory shift in the history of the bunker market. Ships without scrubbers could no longer burn high-sulfur fuel oil in open water. The bunker pool split three ways: most ships switched to VLSFO (0.5% sulfur); roughly 5,000 scrubber-equipped vessels kept burning HSFO at a steep discount that paid back the scrubber investment; and a growing minority used MGO, LNG, or methanol. The HSFO/VLSFO spread widened from nearly zero in 2019 to routinely more than $150 per tonne after the rule took effect. Chapter 9 (Finished Products) covers the product side in detail.
Singapore remains the world's largest bunker port, consistently delivering roughly 50 million tonnes of marine fuel per year, with Fujairah in the UAE and Rotterdam in the Netherlands holding second and third place.
Inland waterways are a minor petroleum transport mode in the US, carrying roughly 3 to 5 percent of total petroleum volumes. The Mississippi River system and the Gulf Intracoastal Waterway move refined products and some crude via barge, typically in 10,000 to 30,000 barrel loads. A standard barge tow is about 50,000 barrels. Pipelines handle 70 to 75 percent of US petroleum movement, coastal and ocean tankers 15 to 20 percent, and rail and truck share the remainder.
Shipping Chokepoints
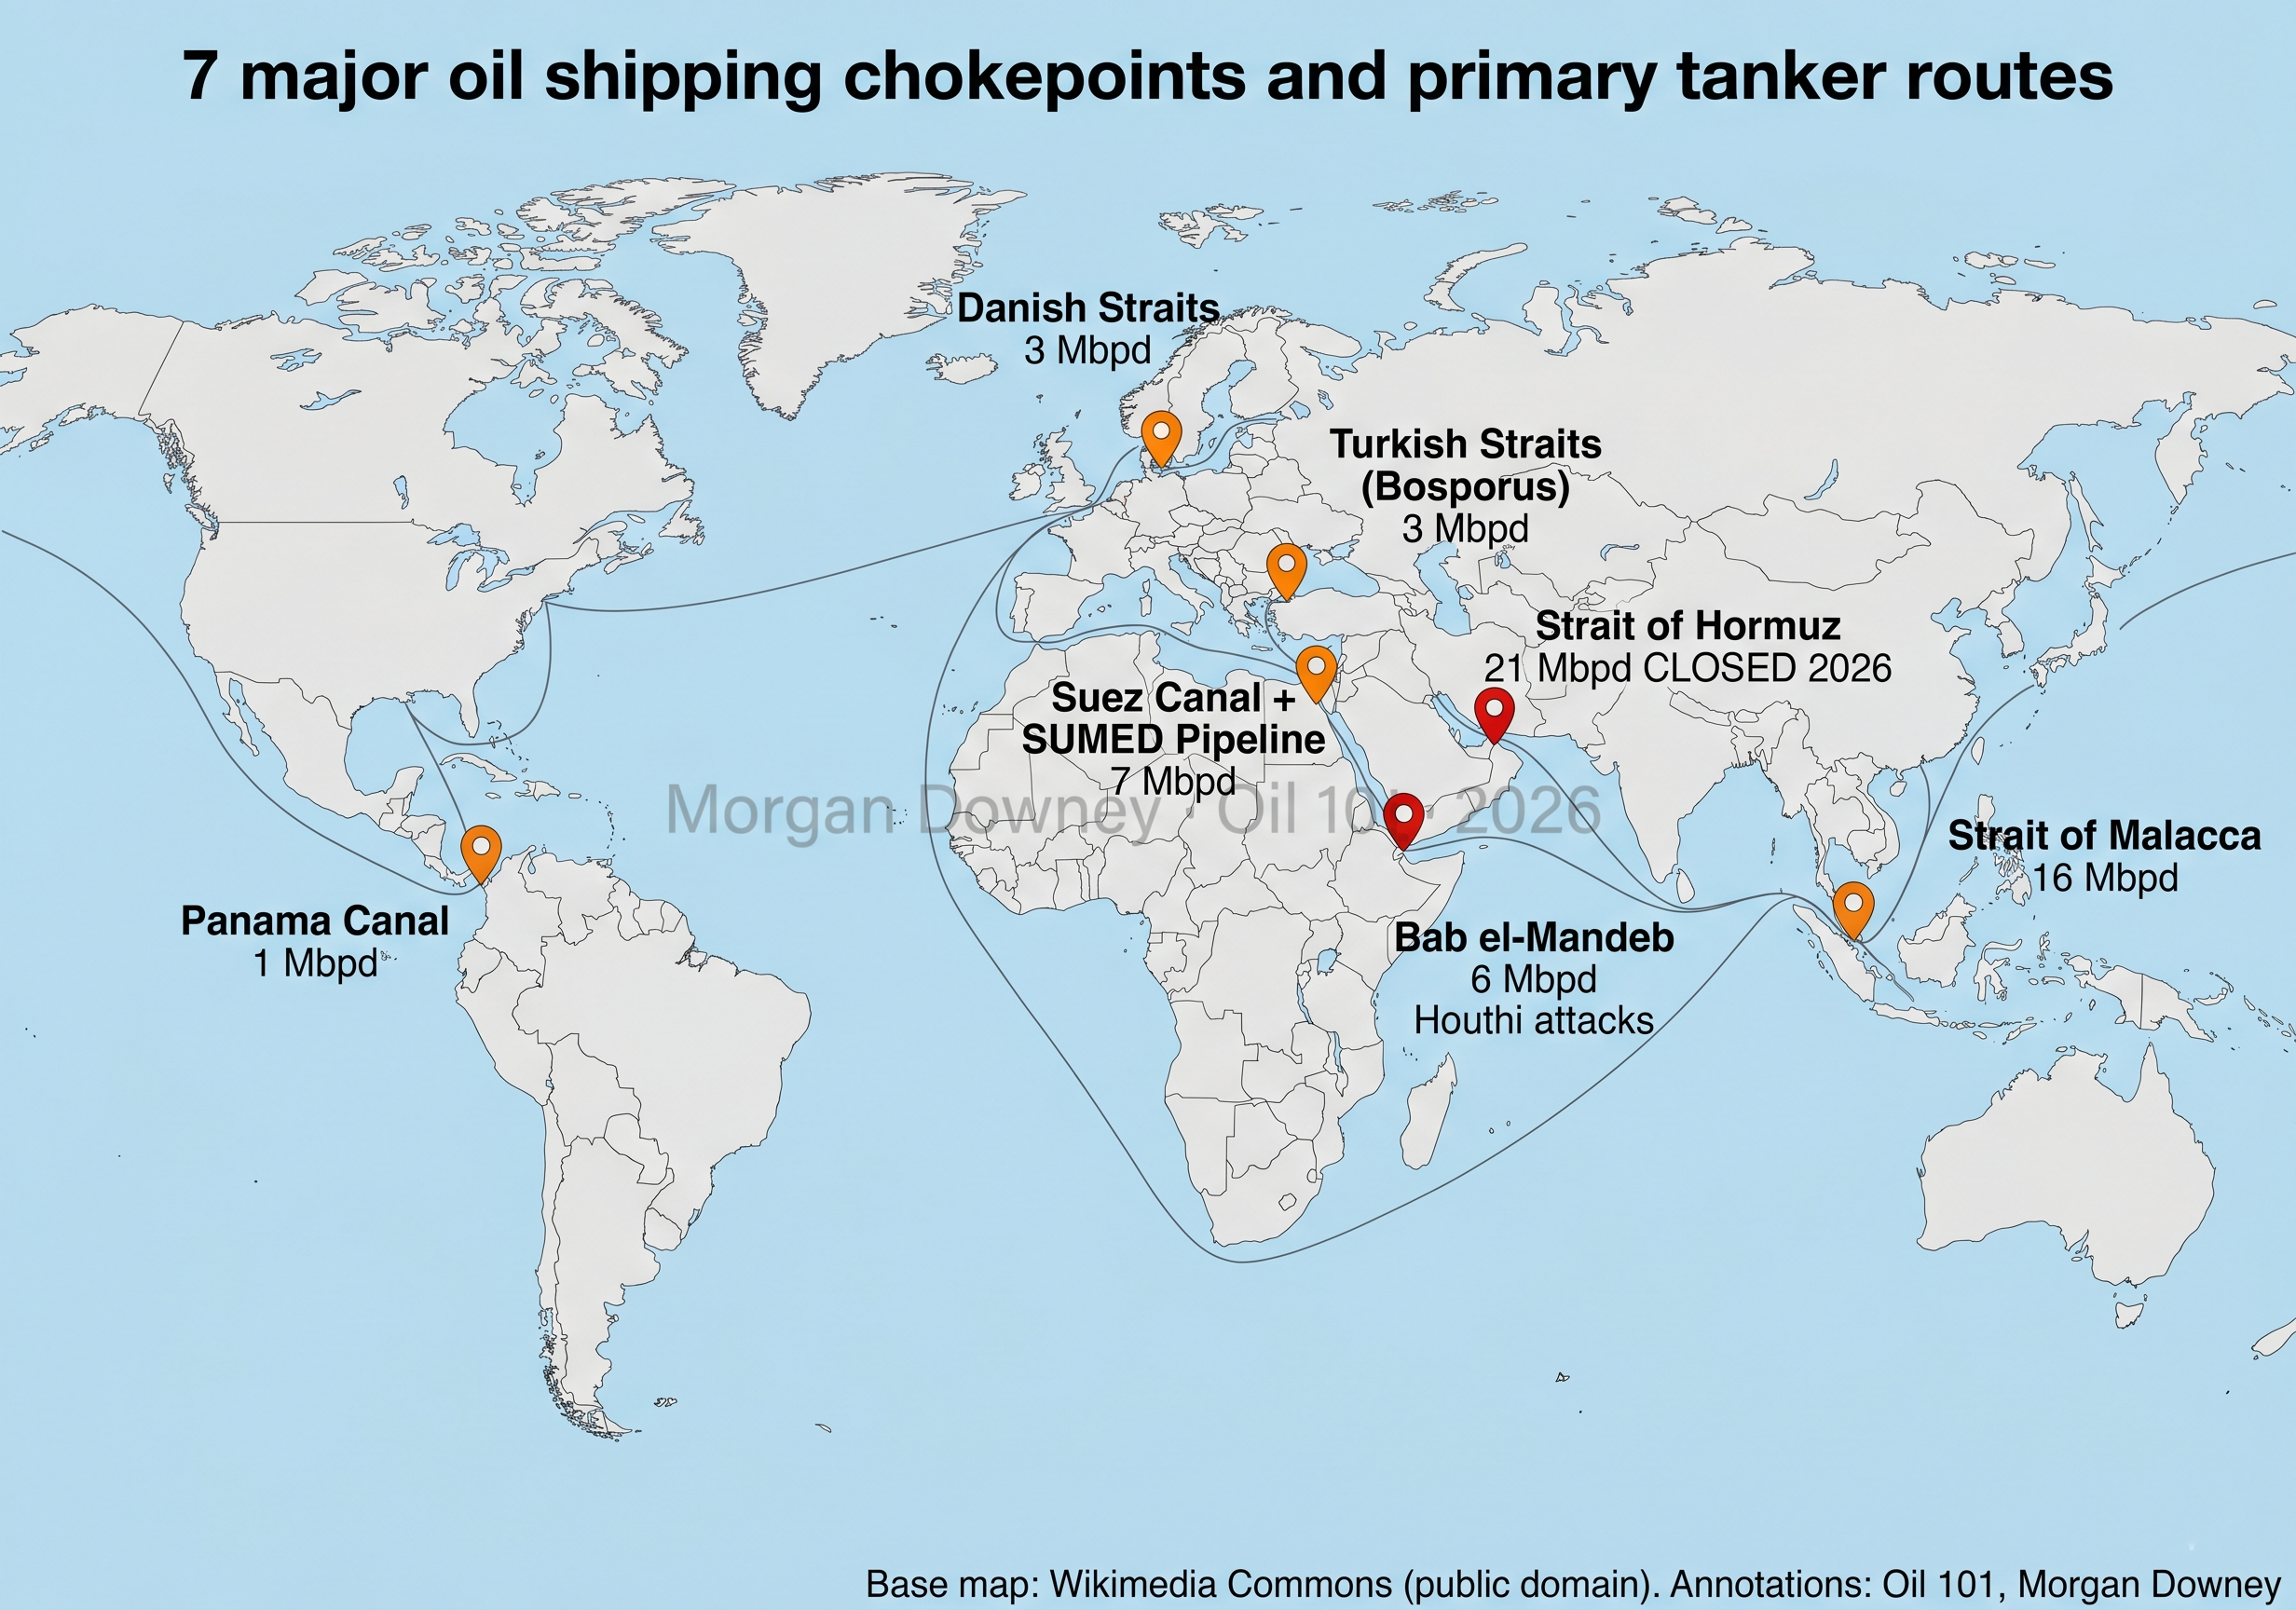
A handful of narrow passages carry most of the world's seaborne oil. Disruption at any of them moves the oil price.
Table 11-4: World oil shipping chokepoints
| Chokepoint | Transit (Mbpd) | Notes |
|---|---|---|
| Strait of Malacca | 23 | Largest by volume. Middle East to China, Japan, Korea. Narrow between Indonesia and Malaysia. |
| Strait of Hormuz | 21 | Persian Gulf exit. The chokepoint with no adequate bypass, and so the one that moves price. |
| Cape of Good Hope | 9 | A route rather than a chokepoint. Volumes rose as Red Sea traffic rerouted around Africa. |
| Suez Canal and SUMED | 5 | Mediterranean link, canal plus the parallel pipeline. Roughly 9 Mbpd before the Red Sea diversions. |
| Danish Straits | 5 | Baltic exit; Russian crude and products. |
| Bab el-Mandeb / Red Sea | 4 | Suez approach from the south. Roughly 9 Mbpd before Houthi strikes began in late 2023. |
| Turkish (Bosporus) Straits | 4 | Russian and Caspian Black Sea crude and products exit. |
| Panama Canal | 2 | USGC to Pacific. Transit was rationed during the 2023 to 2024 drought. |
Two cautions on reading that table. The volumes are EIA estimates for the first half of 2025, before the Hormuz closure, and they cover crude, condensate, and refined products together. And the rows cannot be added up, because the same barrel is counted more than once: a cargo loaded at Ras Tanura for a Chinese refinery passes Hormuz and then Malacca, and a West African cargo for Europe can be counted at the Cape and again at Suez. What the table measures is the exposure at each passage, not a world total.
Malacca carries the largest volume, but Hormuz is the chokepoint that sets the price, and the difference is the presence of an alternative. Traffic denied Malacca can reach the same customers through the Lombok and Sunda straits at the cost of a few days of steaming. Traffic denied Hormuz has nowhere to go, because the bypass pipelines out of Saudi Arabia and the UAE move roughly 7 Mbpd against 21 Mbpd of normal transit. Volume measures how much oil is at stake; the absence of a detour measures how much the price moves.
LNG Carriers in Brief
LNG moves on purpose-built refrigerated tanker ships that keep methane liquid at minus 162 degrees Celsius in insulated spherical (Moss-type) or membrane-wall (Gaztransport and Technigaz) tanks. Standard modern capacity runs 145,000 to 174,000 cubic meters; the Qatari Q-Flex (210,000) and Q-Max (266,000) classes are the largest built. Chapter 24 (US LNG) covers US LNG exports, the ships, and the terminal build-out in detail.
Trading Hubs
Pipelines, tanker terminals, and storage tanks cluster at a handful of hubs where physical oil meets the financial market. The most important hub in the world is Cushing, Oklahoma, the delivery point for WTI crude futures. By 2026 the Permian Basin is the world's most prolific producing region, with new pipeline systems connecting it to US Gulf Coast export terminals at Houston, Corpus Christi, and Freeport.
Table 11-5: Major global crude oil pricing and trading hubs
| Hub | Location | Role |
|---|---|---|
| Cushing | Oklahoma, US | NYMEX WTI delivery point; the most important US pricing hub |
| US Gulf Coast (USGC) | Texas / Louisiana, US | Largest US refining concentration; export terminals at Houston, Corpus Christi, Freeport, Beaumont |
| LOOP | Louisiana, US | Louisiana Offshore Oil Port; only US port able to fully load VLCCs |
| North Sea (Brent) | Sullom Voe, UK | ICE Brent delivery point; prices two-thirds of globally traded crude |
| ARA | Amsterdam / Rotterdam / Antwerp | Leading European products and storage hub; central to NW Europe physical trade |
| Ras Tanura | Saudi Arabia | World's largest crude export terminal (Saudi Aramco) |
| Fujairah | UAE | Strategic Middle East storage and bunkering hub outside the Strait of Hormuz. |
| Singapore | Singapore | Asia's pricing and physical hub; home to Platts MOC and major products trade |
Incoterms and Delivery Pricing
Every physical cargo needs an answer to one question: at what moment does the oil stop being the seller’s problem and become the buyer’s? The International Chamber of Commerce publishes a set of standard answers called Incoterms, revised roughly every decade and currently in the 2020 edition. There are eleven rules in that edition, but seaborne oil uses only a handful of them.
Table 11-6: Delivery terms in seaborne oil
| Term | Who charters the ship | Where risk passes | Typical use |
|---|---|---|---|
| FOB (Free on Board) | Buyer | Load port, on loading | The default for crude term contracts out of the Gulf and West Africa |
| CFR (Cost and Freight) | Seller | Load port, on loading | Seller books the voyage, buyer arranges its own cargo insurance |
| CIF (Cost, Insurance, Freight) | Seller | Load port, on loading | As CFR, with the seller also buying insurance for the buyer’s benefit |
| DAP (Delivered at Place) | Seller | Discharge port, on arrival | Products and spot crude into Europe and Asia; the modern delivered term |
| DES (Delivered Ex Ship) | Seller | Discharge port, on arrival | Retired by the ICC in 2010, still written into oil and LNG contracts by habit |
Under FOB the buyer nominates and charters the vessel, and risk passes as the oil goes on board. Older textbooks put that moment at the ship’s rail, but the ICC abandoned the rail in the 2010 revision because nobody could say precisely when a cargo crossed it. Oil contracts are more specific than the Incoterms are: the general terms and conditions used in the trade fix the delivery point at the permanent hose connection between the loading terminal and the vessel’s manifold, so the flange is the legal boundary between two companies.
The most expensive misunderstanding in this area concerns CIF. The seller pays the freight and buys the insurance, which makes CIF feel like a delivered cargo, and it is not one. Risk still passes at the load port. A buyer whose CIF cargo is lost in mid-ocean owns that loss and must claim on the policy the seller bought on its behalf, and is generally still obliged to pay for oil now on the seabed. Under a genuine delivered term such as DAP the seller carries the voyage and a cargo lost at sea is a cargo never delivered. CFR and CIF are shipment contracts wearing the costume of delivery contracts.
Two further points about what these terms do not do. Incoterms allocate cost and risk; they say nothing about when title passes, which is governed by the sale contract and is frequently a different moment altogether. And they are a starting draft rather than the final word. Serious oil trade runs on house general terms and conditions, the BP and Shell sets being the most widely used, which import the Incoterms and then modify them at length on demurrage, laytime, quality, quantity measurement, and risk of contamination. In a dispute it is the house terms that govern.
The commercial content of the choice is freight. The gap between an FOB price and a delivered price is the cost of the voyage, so a seller quoting delivered has taken a position in the tanker market described earlier in this chapter, and a rise in Worldscale rates between fixing the cargo and fixing the ship comes straight out of the margin. Traders move between the two deliberately. Buying FOB and selling delivered is a way to be long freight without chartering speculatively, and the reverse converts a physical trade into a pure quality and location play.
The above was updated in 2026. For the full original 2009 chapter, download the 1st edition 2009 PDF.