Chapter 5
Industry Overview
Oil industry structure: upstream, midstream, and downstream sectors. IOCs, NOCs, independents, and oilfield service companies.
An Industry in Three Segments
The oil industry, still colloquially called the oil patch, divides cleanly into three segments: upstream, midstream, and downstream. The first edition of Oil 101 put it simply: most companies operate in just one segment, and the few that operate in all three are called vertically integrated. That framing still holds in 2026, even though the cast of companies in each segment has turned over since then.
Table 5-1: The three segments of the oil industry
| Segment | Core activities | Representative assets | Economics |
|---|---|---|---|
| Upstream | Finding and extracting crude oil and natural gas | Leases, seismic data, drilling rigs, wellheads, platforms, gathering lines | Highest risk, highest reward; long cycles, commodity price exposure |
| Midstream | Transportation, gathering, processing, and bulk storage | Pipelines, tankers, railcars, truck fleets, gas processing plants, terminals | Toll-road economics; fee-based contracts and relatively stable cash flows |
| Downstream | Refining, petrochemicals, distribution, retail marketing | Refineries, product pipelines, terminals, retail stations, lubricant plants | Margin-driven; profits depend on the crack spread |
Follow a barrel through the physical chain and the three segments become obvious. Crude originates in a reservoir thousands of feet underground, flows up a wellhead into a small gathering line, gets metered and separated from water and associated gas at a field facility, moves through a trunk pipeline or onto a tanker, arrives at a refinery, is cracked and treated into finished products, then travels out through product pipelines and terminals to the retail station where a driver finally pumps it into a car. Upstream owns the first two stops, midstream owns the middle four, and downstream owns the last three. The handoffs between segments are where prices are discovered, quality is assayed, and custody (and risk) changes hands.
National Oil Companies Versus International Oil Companies
The majority of global crude oil production is controlled by government-owned National Oil Companies (NOCs). This was true when the first edition of Oil 101 was published in 2009, and it remains true today. All OPEC production and roughly a third of non-OPEC production sits under NOC control. Most NOCs exist because, at some point in the 20th century, the state assumed ownership of oil reserves that private industry had originally risked capital to find. Most NOCs still farm out drilling and specialist technical work to private service companies, but the equity barrels belong to the state.
The remainder of global production is split between publicly listed International Oil Companies (IOCs) and a long tail of independents, producers that explore and produce without refining. The former “Seven Sisters” of the 1950s consolidated through four decades of mergers into what the market now calls the Majors or supermajors: ExxonMobil, Shell, Chevron, BP, and TotalEnergies. Add Eni, ConocoPhillips, and Equinor and you have the eight firms that dominate the publicly listed side of the upstream business. Together the supermajors control roughly 12 percent of global crude production in 2026, though they still own close to a fifth of global refining capacity.
Table 5-2: Selected International Oil Companies (approximate 2024 production)
| Company | HQ | 2024 production (Mboe/d) | Primary basins |
|---|---|---|---|
| ExxonMobil | Spring, Texas | 4.3 | Permian, Guyana, Gulf of Mexico, Qatar LNG |
| Shell | London, UK | 2.8 | Gulf of Mexico, Nigeria, Permian, Oman, LNG portfolio |
| Chevron | Houston, Texas | 3.3 | Permian, DJ Basin, Kazakhstan (Tengiz), Australia LNG |
| BP | London, UK | 2.4 | Gulf of Mexico, North Sea, Azerbaijan, Oman |
| TotalEnergies | Courbevoie, France | 2.5 | North Sea, West Africa, Middle East, Argentina, LNG |
| Eni | Rome, Italy | 1.7 | North Africa, Mozambique, Congo, Kazakhstan |
| ConocoPhillips | Houston, Texas | 2.0 | Permian, Eagle Ford, Bakken, Alaska, Norway |
| Equinor | Stavanger, Norway | 2.1 | Norwegian Continental Shelf, Brazil pre-salt, US shale |
| EOG Resources | Houston, Texas | 1.1 | Eagle Ford, Delaware Basin, Powder River, Utica |
Production figures are approximate and drawn from company annual reports and investor presentations. They blend oil, gas, and natural gas liquids on an oil-equivalent basis and can swing year to year with divestitures and acquisitions.
The NOC League Table
National Oil Companies are the heavyweights of the upstream business. Saudi Aramco alone produces more oil than any publicly listed Major, and its 2019 IPO, which remains the largest in history, only partially changed its character: the Saudi state still owns more than 95 percent of the company. Below Aramco sits a long list of NOCs that collectively control roughly half of global oil and gas production and a much larger share of proved reserves.
Table 5-3: Selected National Oil Companies (approximate 2024 production)
| Company | Country | 2024 production (Mboe/d) | Ownership status |
|---|---|---|---|
| Saudi Aramco | Saudi Arabia | 12.7 | Listed on Tadawul, roughly 95 percent state-owned |
| NIOC | Iran | 3.4 | Wholly state-owned |
| CNPC / PetroChina | China | 4.3 | Parent wholly state-owned; PetroChina listed in Hong Kong and Shanghai |
| Rosneft | Russia | 4.0 | Majority state-owned via Rosneftegaz |
| ADNOC | United Arab Emirates | 4.0 | Wholly state-owned; select subsidiaries partially listed |
| Petrobras | Brazil | 2.8 | Listed, federal government holds majority voting shares |
| KPC | Kuwait | 2.7 | Wholly state-owned |
| INOC / SOMO | Iraq | 4.2 | Wholly state-owned |
| QatarEnergy | Qatar | 4.8 | Wholly state-owned (oil, condensate, and North Field LNG) |
| Pemex | Mexico | 1.8 | Wholly state-owned |
| Sonatrach | Algeria | 1.5 | Wholly state-owned |
| PDVSA | Venezuela | 0.9 | Wholly state-owned; production well below pre-2010 levels |
NOC production numbers are harder to verify than those of listed companies. Many NOCs do not publish audited reserves or segment-level output and the figures above are drawn from OPEC monthly reports, IEA estimates, and company disclosures where available.
US Independents: The Shale Cohort
The group that has done the most to reshape the industry since the first edition of this book is the US independents. These are publicly listed E&P companies with no meaningful refining or international presence, and most of their production comes from unconventional shale plays in Texas, New Mexico, North Dakota, Pennsylvania, and Appalachia. The current cohort includes Diamondback Energy (which absorbed Endeavor Energy Resources in 2024 to become the largest pure-play Permian independent after ExxonMobil’s purchase of Pioneer Natural Resources), EOG Resources, Devon Energy, Ovintiv, Coterra Energy, Marathon Oil (acquired by ConocoPhillips in 2024), APA Corporation, EQT (the largest US natural gas producer), and Chesapeake (now merged with Southwestern into Expand Energy). Consolidation has been the dominant theme: the independents pioneered the shale boom, and the Majors are now buying them up to lock in decades of inventory.
Oilfield Services: The Contractors Who Actually Drill
Most upstream operators, NOCs and IOCs alike, do not own their own rigs, pumps, or wireline trucks. They lease equipment and crews from oilfield service companies on a contract basis. The industry is famously cyclical: long stretches of low dayrates punctuated by brief booms when rig capacity tightens. The Big Three of global services (SLB, Halliburton, and Baker Hughes) tower above a large field of specialists.
Table 5-4: Major oilfield service companies
| Company | Core services | Notes |
|---|---|---|
| SLB (formerly Schlumberger) | Seismic, drilling, formation evaluation, completions, digital subsurface software | Largest global services firm, rebranded from Schlumberger in 2022 |
| Halliburton | Pressure pumping (hydraulic fracturing), cementing, drilling fluids, completions | Dominant position in North American onshore frac market |
| Baker Hughes | Drill bits, artificial lift, turbomachinery, LNG compression trains | More diversified into industrial and LNG equipment than its peers |
| Weatherford | Managed pressure drilling, tubular running, well construction, intervention | Emerged from 2019 bankruptcy as a leaner mid-tier services firm |
| NOV (National Oilwell Varco) | Drill rig equipment manufacturing, downhole tools, offshore structures | Equipment supplier; sells to rig contractors |
| ChampionX | Production chemicals, artificial lift, drilling technologies | Pending merger into SLB announced in 2024 |
| Liberty Energy | Hydraulic fracturing services, frac sand logistics | North American pressure pumper; founder became US Energy Secretary in 2025 |
Pure-Play Refiners
The downstream side of the US industry is now dominated by a handful of independent refiners with no upstream exposure. Marathon Petroleum runs the largest US refining system after its 2018 acquisition of Andeavor. Valero Energy is the largest independent refiner in the world by throughput and has an extensive Gulf Coast and West Coast footprint. Phillips 66 spun out of ConocoPhillips in 2012 and operates an integrated refining, midstream, and chemicals business. PBF Energy is a smaller East Coast and West Coast refiner, and HF Sinclair was formed in 2022 by the merger of HollyFrontier and Sinclair Oil. These companies live and die by the crack spread, the margin between the price of crude input and the value of the finished product slate.
Physical Trading Houses
A parallel industry of physical commodity trading houses sits between producers, refiners, and end users, moving barrels across geographies and qualities to capture spread and arbitrage. The five dominant independents are Vitol (Geneva and Rotterdam, the largest independent oil trader by volume), Glencore (Baar, Switzerland, with a large mining arm alongside its oil book), Trafigura (Singapore and Geneva), Gunvor (Geneva), and Mercuria (Geneva). Between them they trade more crude and products than any supermajor lifts. The trading houses own infrastructure too: storage terminals, refineries, shipping, and in several cases upstream equity barrels.
Engineering, Procurement, and Construction
The physical plants that refine crude, liquefy gas, and move product are built by a separate species of contractor called EPC firms (engineering, procurement, and construction). Bechtel is the giant of US LNG construction and has built most of the export trains on the Gulf Coast. Fluor, McDermott, TechnipFMC, Saipem, and Petrofac round out the list of global EPC players that bid on multi-billion dollar refinery, petrochemical, and LNG projects. EPC firms do not own the plants they build; they hand them over to operators at the end of construction and move on to the next contract.
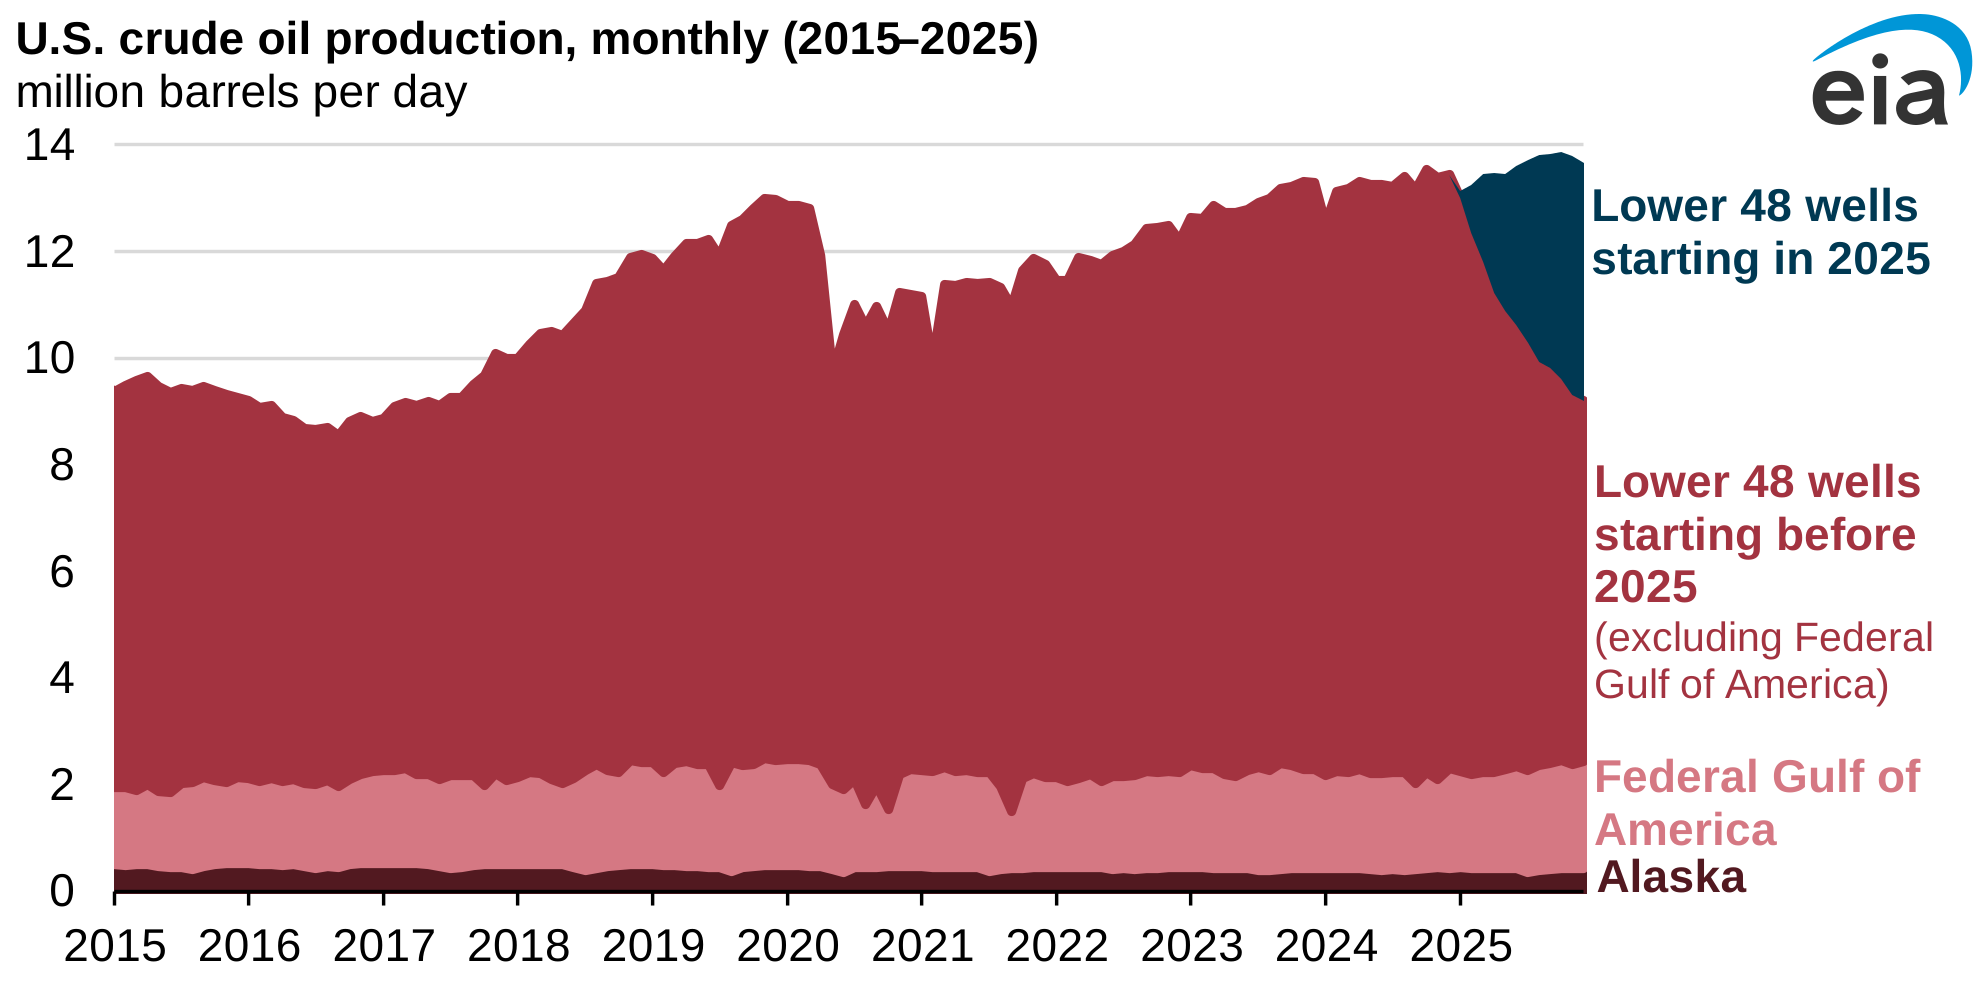
Figure 5-4: Top 20 Oil Companies by Production (Mboe/d, 2024)
Sources: company annual reports, S&P Global, Energy Institute Statistical Review 2024. Illustrative rounded figures. IOC: publicly listed and integrated, including Eni and Equinor despite their state shareholdings. Independent: produces without refining.
Vertical Integration and the Disaggregation Trend
The classical Major was a fully vertically integrated business that explored for oil, produced it, shipped it on its own tankers, refined it in its own refineries, and sold it through its own branded retail stations. That model is still intact at ExxonMobil, Shell, and Chevron, but the trend since the 1990s has been disaggregation. ConocoPhillips spun out Phillips 66 in 2012 and is now a pure-play E&P. Marathon Oil and Marathon Petroleum have been separate companies since 2011. Hess sold its retail network in 2014. The logic is that capital markets pay different multiples for upstream, midstream, and downstream cash flows, and shareholders can put together their own vertical integration by buying shares in specialist firms. The NOCs, by contrast, have moved in the opposite direction, with Saudi Aramco, ADNOC, and QatarEnergy all pushing downstream into refining and petrochemicals to capture more of the value chain.
OPEC and OPEC+
OPEC was formed in Baghdad in 1960 by five founding members: Saudi Arabia, Kuwait, Iran, Iraq, and Venezuela. Its stated purpose was to coordinate production to stabilize prices. In late 2016, OPEC partnered with Russia and nine other non-member producers to form OPEC+, the broadest supply management agreement in the history of the industry. As of 2026, OPEC+ manages production quotas covering roughly 40 percent of global output, and Saudi Arabia remains the de facto leader, wielding the implied threat of flooding the market to punish cheating. Chapter 22 (OPEC+) covers the OPEC+ era, including the 2020 Saudi-Russia price war and the supply discipline that has defined the group since.
OPEC reserves statements have been unreliable since the 1980s, when members artificially inflated estimates to secure larger production quotas. Despite decades of production, few OPEC countries have materially revised their reserve figures downward.
The Downstream Footprint
There are roughly 650 refineries worldwide with combined capacity near 102 million barrels per day. The US has about 130 refineries with 18.5 million barrels per day of capacity. A new complex refinery processing 500,000 barrels per day costs over 10 billion dollars and takes 5 to 7 years to build. Since 2010, almost all net new refinery capacity has been built in the Middle East, India, and China rather than in the US or Europe, where older plants have been closing or converting to biofuels. Refineries that remain have steadily become more complex through what the industry calls complexity creep, adding cracking and hydrogen addition equipment so the same plant can squeeze more light products out of progressively heavier crude.
Key Market Institutions
The EIA (Energy Information Administration) publishes the most closely watched weekly US petroleum inventory report each Wednesday at 10:30 AM Eastern Time. Submission by surveyed firms is compulsory, which is why the EIA numbers are treated as the gold standard of oil statistics. The IEA (International Energy Agency) coordinates OECD strategic reserves (a minimum of 90 days of net imports) and publishes the monthly Oil Market Report that drives most demand forecasting. The CFTC publishes the weekly Commitments of Traders report showing futures positioning by category of trader. Price reporting agencies Platts(now part of S&P Global Commodity Insights) and Argus Media assess daily spot prices that are then used in formula pricing worldwide; the assessed prices they publish underpin trillions of dollars of physical contracts every year.
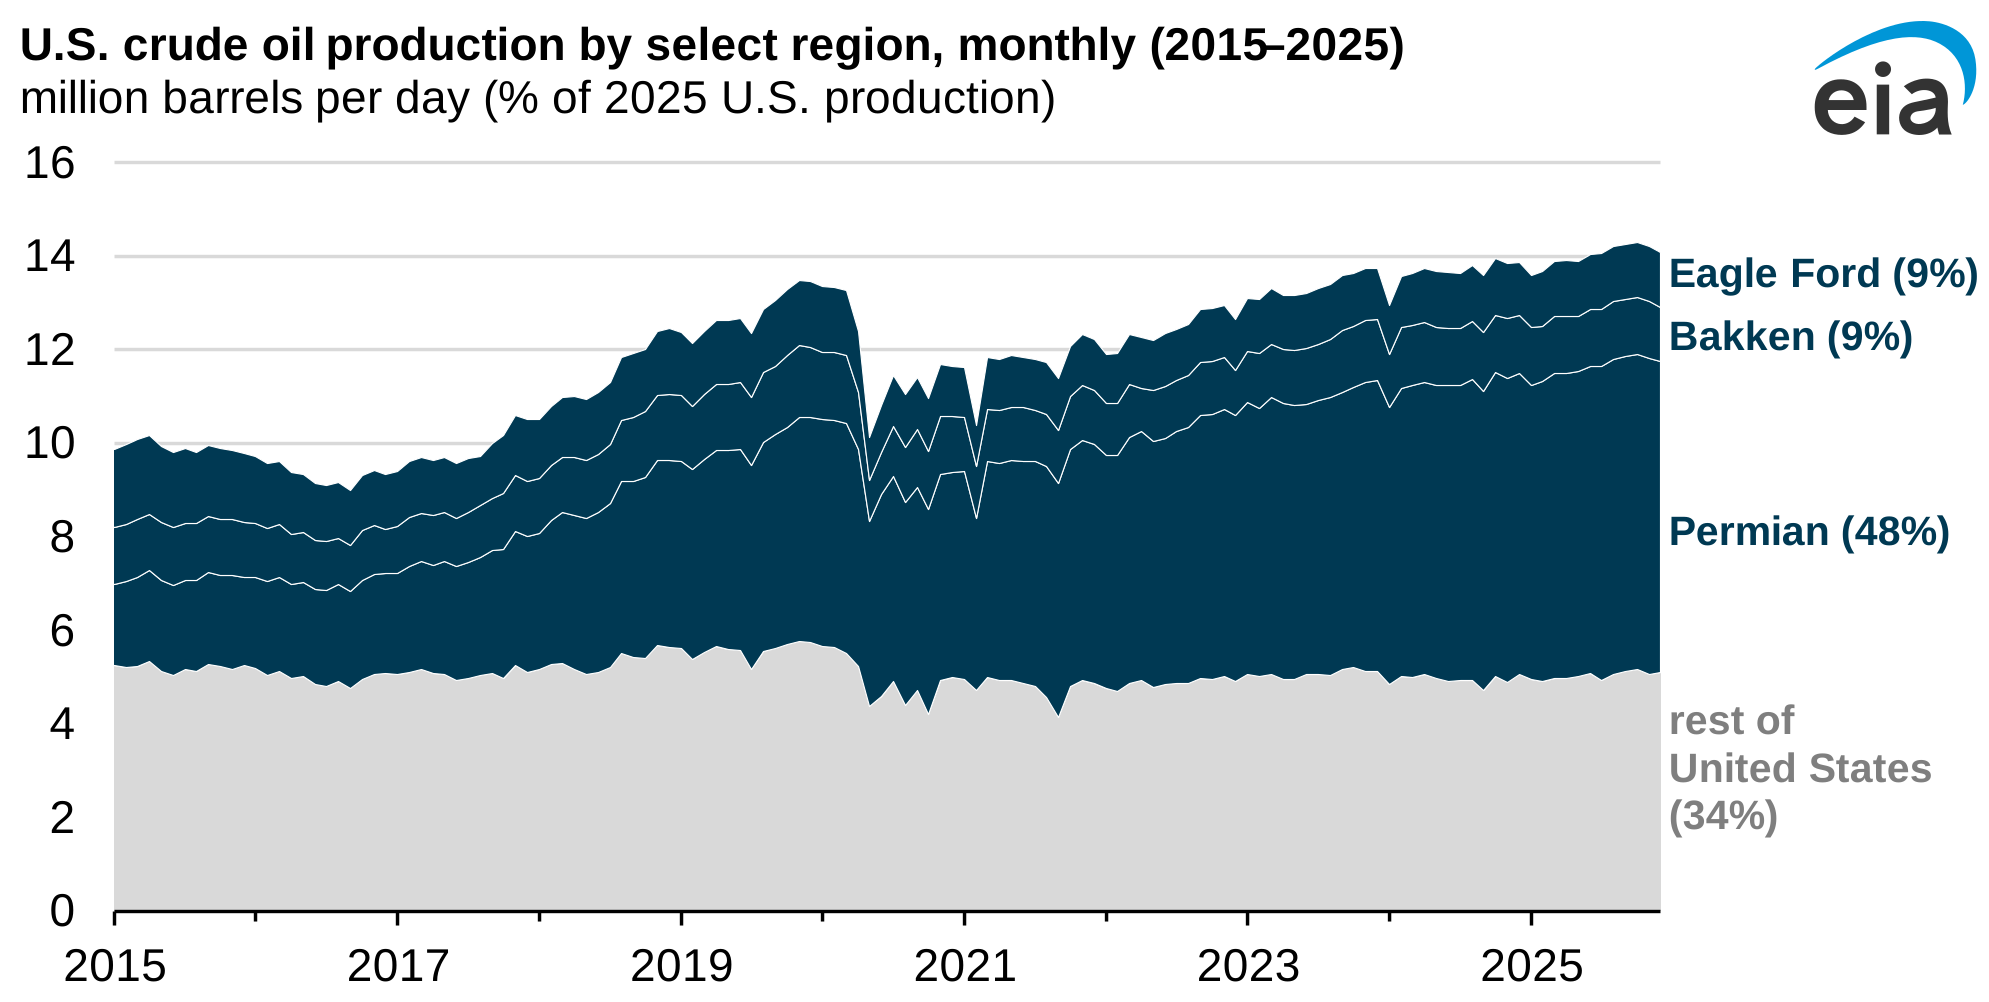
US shale rewrote the industry's structure. The US became a net petroleum exporter in 2019 for the first time since the 1940s, reshaping geopolitics and cutting OPEC's pricing power. How that happened is the subject of Chapter 21 (Shale Revolution).
The above was updated in 2026. For the full original 2009 chapter, download the 1st edition 2009 PDF.